|
Download Data (XLS File) |
|
||||||||
|
||||||||
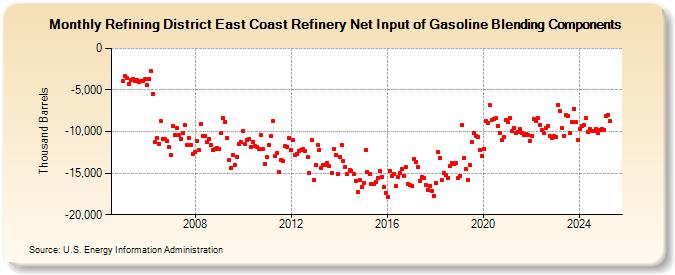
| Refining District East Coast Refinery Net Input of Gasoline Blending Components (Thousand Barrels) | ||||||||
| Year | Jan | Feb | Mar | Apr | May | Jun | Jul | Aug | Sep | Oct | Nov | Dec |
|---|---|---|---|---|---|---|---|---|---|---|---|---|
| 2005 | -3,935 | -3,307 | -3,552 | -4,251 | -3,851 | -3,658 | -3,949 | -3,779 | -4,063 | -3,961 | -3,872 | -3,716 |
| 2006 | -4,446 | -3,647 | -2,726 | -5,440 | -11,287 | -10,717 | -11,449 | -8,756 | -10,888 | -10,929 | -11,088 | -11,914 |
| 2007 | -12,836 | -9,293 | -10,390 | -9,558 | -10,410 | -10,858 | -10,131 | -9,228 | -11,558 | -10,764 | -11,665 | -12,733 |
| 2008 | -12,404 | -11,118 | -12,237 | -9,116 | -10,569 | -10,532 | -11,264 | -10,855 | -11,643 | -12,231 | -12,137 | -12,003 |
| 2009 | -12,095 | -10,208 | -8,354 | -8,817 | -10,776 | -13,475 | -14,399 | -12,793 | -14,013 | -13,065 | -11,474 | -11,280 |
| 2010 | -9,882 | -11,511 | -10,960 | -10,838 | -11,880 | -11,235 | -11,723 | -11,883 | -12,140 | -10,451 | -12,055 | -13,899 |
| 2011 | -13,102 | -11,648 | -10,581 | -8,720 | -12,945 | -12,600 | -14,848 | -13,460 | -13,601 | -11,750 | -11,823 | -10,788 |
| 2012 | -12,204 | -11,064 | -12,789 | -12,730 | -12,349 | -12,196 | -12,103 | -12,384 | -13,019 | -14,963 | -10,972 | -15,790 |
| 2013 | -14,039 | -11,570 | -12,169 | -14,353 | -13,997 | -13,984 | -13,807 | -14,129 | -14,924 | -12,133 | -12,801 | -15,109 |
| 2014 | -13,005 | -11,674 | -13,513 | -14,222 | -15,091 | -14,640 | -14,687 | -15,151 | -15,941 | -17,292 | -15,878 | -16,667 |
| 2015 | -16,191 | -12,176 | -14,864 | -15,088 | -16,356 | -16,354 | -16,073 | -15,613 | -14,764 | -15,424 | -16,708 | -17,396 |
| 2016 | -17,889 | -14,746 | -15,326 | -15,154 | -16,492 | -15,493 | -15,028 | -14,555 | -15,292 | -14,284 | -16,271 | -16,453 |
| 2017 | -16,532 | -13,243 | -13,700 | -14,297 | -15,898 | -15,508 | -15,569 | -16,389 | -17,068 | -16,492 | -17,144 | -17,713 |
| 2018 | -16,145 | -12,462 | -13,181 | -15,848 | -14,946 | -15,260 | -15,536 | -14,180 | -13,798 | -13,885 | -13,783 | -15,632 |
| 2019 | -15,343 | -9,219 | -13,190 | -14,475 | -15,842 | -13,983 | -11,258 | -10,147 | -10,586 | -10,681 | -12,206 | -12,971 |
| 2020 | -12,081 | -8,719 | -8,996 | -6,866 | -8,592 | -8,431 | -8,373 | -9,349 | -10,138 | -10,968 | -10,652 | -8,599 |
| 2021 | -8,841 | -8,322 | -9,980 | -9,566 | -10,220 | -10,053 | -9,746 | -10,208 | -10,400 | -10,249 | -10,387 | -11,161 |
| 2022 | -10,575 | -8,477 | -8,752 | -8,390 | -9,198 | -9,834 | -10,118 | -9,617 | -9,280 | -10,511 | -10,769 | -10,525 |
| 2023 | -10,675 | -6,833 | -7,568 | -9,566 | -10,501 | -7,988 | -8,111 | -10,179 | -8,813 | -7,254 | -8,858 | -10,972 |
| 2024 | -9,692 | |||||||||||
| - = No Data Reported; -- = Not Applicable; NA = Not Available; W = Withheld to avoid disclosure of individual company data. |
| Release Date: 3/29/2024 |
| Next Release Date: 4/30/2024 |