|
Download Data (XLS File) |
|
||||||||
|
||||||||
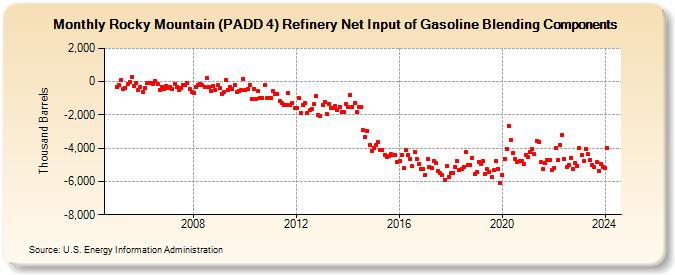
| Rocky Mountain (PADD 4) Refinery Net Input of Gasoline Blending Components (Thousand Barrels) | ||||||||
| Year | Jan | Feb | Mar | Apr | May | Jun | Jul | Aug | Sep | Oct | Nov | Dec |
|---|---|---|---|---|---|---|---|---|---|---|---|---|
| 2005 | -332 | -217 | 110 | -463 | -357 | -162 | -5 | 263 | -243 | -74 | -522 | -300 |
| 2006 | -601 | -381 | -109 | -65 | -56 | -138 | 33 | -122 | -472 | -310 | -447 | -236 |
| 2007 | -410 | -320 | -448 | -121 | -300 | -478 | -395 | -210 | -217 | -52 | -471 | -649 |
| 2008 | -654 | -343 | -183 | -131 | -198 | -341 | 197 | -302 | -582 | -262 | -507 | -206 |
| 2009 | -370 | -719 | -646 | 105 | -514 | -313 | -440 | -172 | -622 | -582 | -526 | 185 |
| 2010 | -512 | -426 | -216 | -1,019 | -424 | -1,023 | -579 | -975 | -975 | -222 | -996 | -973 |
| 2011 | -988 | -583 | -765 | -744 | -1,162 | -1,258 | -1,428 | -1,376 | -707 | -1,393 | -1,308 | -1,579 |
| 2012 | -1,565 | -991 | -1,863 | -1,396 | -1,293 | -1,898 | -1,724 | -1,650 | -1,347 | -883 | -2,018 | -2,043 |
| 2013 | -1,413 | -1,194 | -1,938 | -1,354 | -1,598 | -1,592 | -1,473 | -1,733 | -1,518 | -1,832 | -1,843 | -1,324 |
| 2014 | -1,527 | -808 | -1,510 | -1,285 | -1,844 | -1,518 | -1,517 | -2,896 | -3,335 | -2,963 | -3,814 | -4,144 |
| 2015 | -3,974 | -3,833 | -3,649 | -4,103 | -4,121 | -4,382 | -4,522 | -4,453 | -4,373 | -4,403 | -4,395 | -4,859 |
| 2016 | -4,767 | -4,412 | -5,214 | -4,108 | -4,415 | -4,627 | -5,100 | -4,237 | -4,622 | -4,954 | -5,227 | -5,244 |
| 2017 | -5,607 | -4,643 | -5,125 | -5,181 | -4,787 | -4,866 | -5,357 | -5,506 | -5,607 | -5,893 | -5,060 | -5,713 |
| 2018 | -5,478 | -5,511 | -5,113 | -4,785 | -5,335 | -5,227 | -5,107 | -4,224 | -5,011 | -5,032 | -4,600 | -5,575 |
| 2019 | -5,460 | -4,806 | -4,950 | -4,793 | -5,544 | -5,271 | -5,427 | -5,752 | -5,318 | -4,761 | -5,229 | -6,083 |
| 2020 | -5,586 | -4,658 | -4,019 | -2,673 | -3,509 | -4,314 | -4,637 | -4,838 | -4,799 | -4,766 | -4,965 | -4,393 |
| 2021 | -4,546 | -4,222 | -4,039 | -4,363 | -3,549 | -3,604 | -4,858 | -5,245 | -4,916 | -4,734 | -4,685 | -5,341 |
| 2022 | -5,215 | -4,016 | -4,700 | -3,810 | -3,180 | -4,634 | -5,119 | -4,983 | -4,578 | -5,265 | -4,910 | -5,046 |
| 2023 | -3,979 | -4,413 | -4,761 | -4,045 | -4,356 | -4,717 | -4,996 | -5,156 | -4,858 | -5,364 | -4,949 | -5,152 |
| 2024 | -5,221 | |||||||||||
| - = No Data Reported; -- = Not Applicable; NA = Not Available; W = Withheld to avoid disclosure of individual company data. |
| Release Date: 3/29/2024 |
| Next Release Date: 4/30/2024 |