|
Download Data (XLS File) |
|
||||||||
|
||||||||
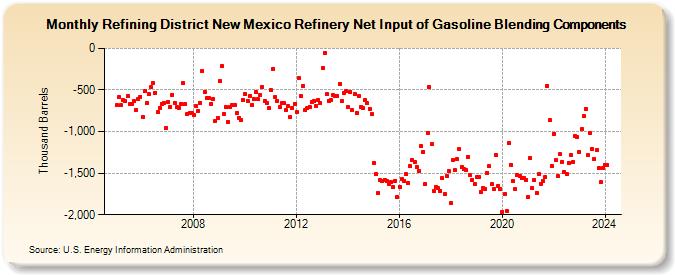
| Refining District New Mexico Refinery Net Input of Gasoline Blending Components (Thousand Barrels) | ||||||||
| Year | Jan | Feb | Mar | Apr | May | Jun | Jul | Aug | Sep | Oct | Nov | Dec |
|---|---|---|---|---|---|---|---|---|---|---|---|---|
| 2005 | -685 | -590 | -684 | -624 | -637 | -574 | -669 | -663 | -638 | -737 | -603 | -579 |
| 2006 | -830 | -516 | -657 | -553 | -468 | -414 | -532 | -766 | -712 | -667 | -657 | -954 |
| 2007 | -639 | -702 | -557 | -654 | -706 | -713 | -665 | -419 | -670 | -790 | -774 | -781 |
| 2008 | -798 | -697 | -751 | -652 | -270 | -520 | -599 | -601 | -664 | -607 | -869 | -837 |
| 2009 | -394 | -211 | -784 | -708 | -882 | -704 | -677 | -686 | -775 | -832 | -866 | -617 |
| 2010 | -549 | -629 | -573 | -675 | -612 | -527 | -612 | -561 | -467 | -637 | -656 | -717 |
| 2011 | -506 | -246 | -587 | -627 | -709 | -657 | -661 | -743 | -690 | -827 | -711 | -665 |
| 2012 | -765 | -362 | -572 | -452 | -743 | -722 | -702 | -648 | -636 | -688 | -623 | -662 |
| 2013 | -233 | -51 | -552 | -627 | -617 | -565 | -568 | -576 | -429 | -636 | -540 | -507 |
| 2014 | -705 | -523 | -739 | -550 | -773 | -575 | -703 | -720 | -623 | -662 | -727 | -792 |
| 2015 | -1,378 | -1,514 | -1,740 | -1,583 | -1,597 | -1,583 | -1,600 | -1,629 | -1,607 | -1,672 | -1,591 | -1,784 |
| 2016 | -1,662 | -1,575 | -1,595 | -1,515 | -1,618 | -1,418 | -1,342 | -1,365 | -1,426 | -1,470 | -1,175 | -1,241 |
| 2017 | -1,631 | -1,017 | -465 | -1,154 | -1,718 | -1,666 | -1,683 | -1,713 | -1,563 | -1,750 | -1,532 | -1,480 |
| 2018 | -1,859 | -1,341 | -1,467 | -1,335 | -1,214 | -1,432 | -1,447 | -1,461 | -1,300 | -1,524 | -1,578 | -1,636 |
| 2019 | -1,550 | -1,541 | -1,727 | -1,675 | -1,691 | -1,494 | -1,420 | -1,636 | -1,693 | -1,282 | -1,650 | -1,688 |
| 2020 | -1,962 | -1,754 | -1,956 | -1,140 | -1,397 | -1,595 | -1,695 | -1,517 | -1,532 | -1,564 | -1,563 | -1,579 |
| 2021 | -1,786 | -1,321 | -1,682 | -1,584 | -1,734 | -1,516 | -1,629 | -1,595 | -1,548 | -447 | -865 | -1,409 |
| 2022 | -1,025 | -1,342 | -1,536 | -1,273 | -1,362 | -1,485 | -1,511 | -1,375 | -1,280 | -1,369 | -1,051 | -1,071 |
| 2023 | -1,242 | -975 | -816 | -726 | -1,285 | -1,018 | -1,207 | -1,329 | -1,223 | -1,443 | -1,612 | -1,443 |
| 2024 | -1,398 | |||||||||||
| - = No Data Reported; -- = Not Applicable; NA = Not Available; W = Withheld to avoid disclosure of individual company data. |
| Release Date: 3/29/2024 |
| Next Release Date: 4/30/2024 |