|
Download Data (XLS File) |
|
||||||||
|
||||||||
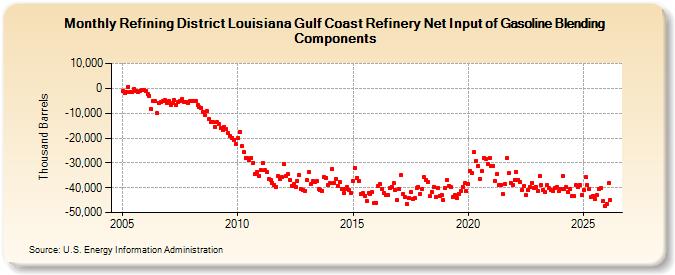
| Refining District Louisiana Gulf Coast Refinery Net Input of Gasoline Blending Components (Thousand Barrels) | ||||||||
| Year | Jan | Feb | Mar | Apr | May | Jun | Jul | Aug | Sep | Oct | Nov | Dec |
|---|---|---|---|---|---|---|---|---|---|---|---|---|
| 2005 | -1,194 | -1,736 | -1,305 | 646 | -1,348 | -1,619 | -357 | -881 | -1,554 | -1,091 | -734 | -640 |
| 2006 | -1,234 | -2,142 | -2,983 | -8,224 | -4,993 | -5,189 | -10,040 | -5,763 | -5,385 | -5,130 | -4,661 | -5,883 |
| 2007 | -5,243 | -6,509 | -5,809 | -4,774 | -6,520 | -5,640 | -5,022 | -4,313 | -5,541 | -5,380 | -5,857 | -5,236 |
| 2008 | -5,154 | -5,301 | -5,137 | -6,752 | -7,477 | -7,883 | -9,343 | -10,888 | -9,194 | -12,475 | -13,660 | -13,696 |
| 2009 | -15,476 | -13,690 | -14,214 | -16,042 | -16,908 | -15,576 | -16,518 | -18,129 | -19,074 | -19,845 | -20,675 | -22,449 |
| 2010 | -20,182 | -17,384 | -23,294 | -25,681 | -28,084 | -28,063 | -28,698 | -27,949 | -29,886 | -34,467 | -33,760 | -35,209 |
| 2011 | -33,014 | -30,172 | -33,020 | -33,561 | -36,552 | -36,720 | -37,924 | -38,720 | -39,571 | -35,363 | -36,358 | -35,840 |
| 2012 | -30,630 | -35,257 | -34,602 | -36,772 | -39,170 | -38,612 | -39,704 | -37,295 | -34,970 | -40,630 | -40,855 | -41,293 |
| 2013 | -37,006 | -33,749 | -38,567 | -37,469 | -37,836 | -37,202 | -40,630 | -40,795 | -41,139 | -35,743 | -35,905 | -38,798 |
| 2014 | -38,276 | -32,450 | -38,074 | -36,496 | -39,191 | -37,671 | -40,492 | -42,277 | -40,403 | -39,863 | -40,903 | -42,112 |
| 2015 | -37,137 | -31,902 | -35,961 | -37,200 | -42,571 | -42,238 | -43,378 | -45,370 | -42,143 | -42,415 | -41,895 | -46,062 |
| 2016 | -46,046 | -39,171 | -38,607 | -40,573 | -42,213 | -43,079 | -42,880 | -40,296 | -39,561 | -38,259 | -41,081 | -45,126 |
| 2017 | -40,596 | -34,987 | -42,514 | -43,671 | -46,463 | -44,306 | -41,878 | -44,413 | -44,275 | -39,944 | -39,647 | -42,477 |
| 2018 | -40,669 | -35,797 | -36,712 | -37,871 | -43,471 | -41,601 | -39,638 | -43,755 | -40,106 | -43,208 | -42,884 | -45,145 |
| 2019 | -40,075 | -36,905 | -39,180 | -39,868 | -43,697 | -43,012 | -44,213 | -42,384 | -41,271 | -39,666 | -38,257 | -41,369 |
| 2020 | -38,577 | -33,247 | -34,072 | -25,663 | -29,239 | -31,143 | -36,384 | -33,362 | -27,847 | -28,307 | -30,306 | -27,998 |
| 2021 | -31,346 | -31,328 | -37,250 | -34,476 | -38,946 | -38,883 | -42,552 | -38,553 | -28,216 | -34,214 | -37,949 | -38,870 |
| 2022 | -36,976 | -33,628 | -36,729 | -37,864 | -40,849 | -39,449 | -43,128 | -40,936 | -39,541 | -37,968 | -40,020 | -39,628 |
| 2023 | -41,368 | -35,374 | -38,922 | -40,733 | -41,647 | -38,970 | -40,279 | -40,741 | -41,124 | -40,081 | -39,802 | -41,353 |
| 2024 | -40,158 | |||||||||||
| - = No Data Reported; -- = Not Applicable; NA = Not Available; W = Withheld to avoid disclosure of individual company data. |
| Release Date: 3/29/2024 |
| Next Release Date: 4/30/2024 |