|
Download Data (XLS File) |
|
||||||||
|
||||||||
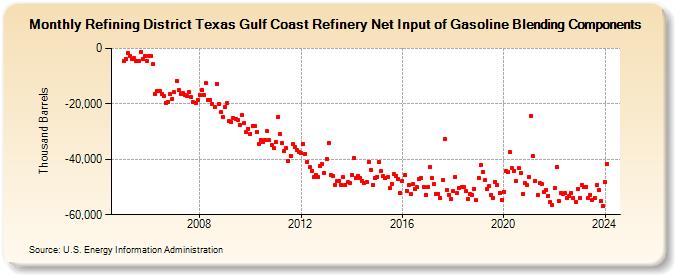
| Refining District Texas Gulf Coast Refinery Net Input of Gasoline Blending Components (Thousand Barrels) | ||||||||
| Year | Jan | Feb | Mar | Apr | May | Jun | Jul | Aug | Sep | Oct | Nov | Dec |
|---|---|---|---|---|---|---|---|---|---|---|---|---|
| 2005 | -4,722 | -3,809 | -1,498 | -2,579 | -3,797 | -3,569 | -4,407 | -4,604 | -1,462 | -3,872 | -2,690 | -4,528 |
| 2006 | -2,699 | -2,679 | -5,759 | -16,416 | -15,471 | -15,230 | -16,295 | -17,307 | -19,572 | -19,355 | -16,587 | -18,128 |
| 2007 | -15,850 | -11,735 | -15,146 | -16,447 | -16,195 | -16,750 | -17,256 | -15,597 | -17,704 | -19,408 | -19,661 | -18,463 |
| 2008 | -16,775 | -14,934 | -16,752 | -12,580 | -18,608 | -18,552 | -20,127 | -21,030 | -12,805 | -20,099 | -23,040 | -24,927 |
| 2009 | -21,012 | -19,849 | -26,285 | -26,652 | -25,197 | -25,604 | -25,664 | -27,477 | -24,034 | -26,891 | -30,124 | -28,986 |
| 2010 | -30,747 | -27,836 | -27,978 | -30,128 | -34,609 | -32,980 | -33,658 | -33,104 | -29,926 | -33,192 | -34,914 | -35,996 |
| 2011 | -33,792 | -24,795 | -31,041 | -34,297 | -37,193 | -35,953 | -40,682 | -38,655 | -34,669 | -35,674 | -36,586 | -37,295 |
| 2012 | -37,863 | -34,574 | -38,076 | -40,914 | -42,842 | -44,059 | -46,480 | -45,663 | -46,485 | -42,370 | -41,829 | -44,786 |
| 2013 | -39,956 | -34,045 | -45,564 | -45,856 | -49,235 | -47,861 | -47,823 | -49,166 | -46,484 | -49,405 | -48,346 | -48,599 |
| 2014 | -45,648 | -39,364 | -46,718 | -45,896 | -46,856 | -47,852 | -48,710 | -48,108 | -40,839 | -43,740 | -49,186 | -46,725 |
| 2015 | -46,283 | -41,023 | -44,289 | -46,122 | -46,788 | -46,442 | -50,522 | -48,783 | -45,450 | -45,880 | -47,042 | -52,039 |
| 2016 | -47,850 | -45,804 | -51,343 | -49,459 | -52,563 | -48,960 | -50,753 | -50,157 | -47,165 | -46,821 | -50,015 | -52,805 |
| 2017 | -50,023 | -42,780 | -46,681 | -49,090 | -52,542 | -52,426 | -53,929 | -47,489 | -32,538 | -50,918 | -52,711 | -54,253 |
| 2018 | -51,624 | -46,220 | -52,299 | -50,203 | -50,039 | -50,161 | -51,586 | -54,491 | -52,611 | -52,767 | -50,591 | -54,693 |
| 2019 | -46,593 | -42,094 | -44,658 | -47,554 | -50,816 | -49,812 | -52,755 | -54,000 | -48,255 | -49,154 | -52,155 | -54,655 |
| 2020 | -51,661 | -44,235 | -44,703 | -37,516 | -43,157 | -44,069 | -47,986 | -43,209 | -44,851 | -52,405 | -48,712 | -49,323 |
| 2021 | -46,347 | -24,219 | -38,854 | -47,668 | -52,907 | -48,590 | -48,981 | -51,894 | -50,909 | -53,141 | -55,383 | -56,362 |
| 2022 | -50,315 | -42,721 | -55,040 | -52,229 | -52,390 | -52,227 | -53,955 | -53,229 | -52,178 | -54,089 | -55,307 | -50,709 |
| 2023 | -53,911 | -49,182 | -50,125 | -49,945 | -54,084 | -52,779 | -54,759 | -54,127 | -49,397 | -51,197 | -55,071 | -56,816 |
| 2024 | -48,238 | |||||||||||
| - = No Data Reported; -- = Not Applicable; NA = Not Available; W = Withheld to avoid disclosure of individual company data. |
| Release Date: 3/29/2024 |
| Next Release Date: 4/30/2024 |