|
Download Data (XLS File) |
|
||||||||
|
||||||||
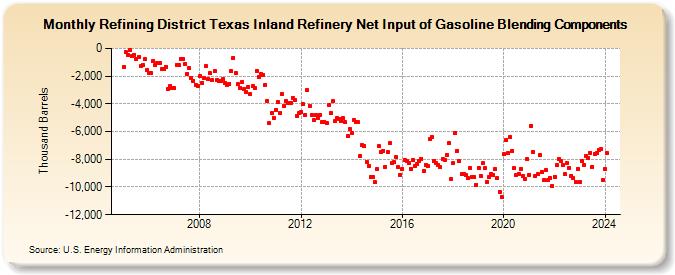
| Refining District Texas Inland Refinery Net Input of Gasoline Blending Components (Thousand Barrels) | ||||||||
| Year | Jan | Feb | Mar | Apr | May | Jun | Jul | Aug | Sep | Oct | Nov | Dec |
|---|---|---|---|---|---|---|---|---|---|---|---|---|
| 2005 | -1,307 | -265 | -449 | -118 | -563 | -449 | -795 | -638 | -1,259 | -1,175 | -790 | -1,561 |
| 2006 | -1,788 | -1,804 | -920 | -1,201 | -1,084 | -1,052 | -1,503 | -1,520 | -1,317 | -2,931 | -2,696 | -2,844 |
| 2007 | -2,873 | -1,165 | -1,176 | -739 | -777 | -1,101 | -1,825 | -1,443 | -2,149 | -2,352 | -2,619 | -2,712 |
| 2008 | -2,018 | -2,490 | -2,164 | -1,305 | -2,218 | -1,801 | -2,287 | -1,616 | -2,274 | -2,377 | -2,363 | -2,232 |
| 2009 | -2,473 | -2,636 | -2,539 | -1,646 | -666 | -1,792 | -2,591 | -2,838 | -2,412 | -2,916 | -3,159 | -2,757 |
| 2010 | -3,304 | -2,742 | -2,877 | -1,605 | -2,032 | -1,817 | -1,903 | -2,634 | -3,778 | -5,419 | -4,685 | -5,000 |
| 2011 | -4,412 | -3,868 | -4,646 | -3,300 | -4,123 | -3,815 | -3,942 | -3,967 | -3,574 | -3,712 | -4,864 | -4,667 |
| 2012 | -4,579 | -4,043 | -4,800 | -3,033 | -4,126 | -4,787 | -5,182 | -4,780 | -4,989 | -4,794 | -5,275 | -5,305 |
| 2013 | -5,369 | -4,058 | -4,652 | -3,821 | -5,241 | -5,044 | -5,080 | -5,254 | -5,046 | -5,335 | -6,356 | -5,841 |
| 2014 | -6,133 | -5,160 | -5,298 | -5,336 | -7,780 | -6,971 | -7,037 | -8,194 | -8,479 | -9,286 | -9,295 | -9,658 |
| 2015 | -8,737 | -7,077 | -7,454 | -7,393 | -8,523 | -7,510 | -6,858 | -8,289 | -8,226 | -7,824 | -8,560 | -9,116 |
| 2016 | -8,696 | -8,034 | -8,096 | -8,262 | -8,684 | -8,062 | -8,499 | -8,335 | -8,090 | -7,974 | -8,868 | -8,387 |
| 2017 | -8,492 | -6,544 | -6,407 | -8,099 | -8,282 | -8,427 | -8,580 | -7,967 | -8,033 | -7,682 | -6,828 | -9,392 |
| 2018 | -8,303 | -6,073 | -7,369 | -8,139 | -9,094 | -9,055 | -9,156 | -9,364 | -8,625 | -9,269 | -9,286 | -9,823 |
| 2019 | -8,627 | -9,203 | -8,291 | -8,665 | -9,627 | -9,274 | -9,038 | -9,149 | -8,710 | -9,387 | -10,342 | -10,738 |
| 2020 | -7,639 | -6,645 | -7,578 | -6,393 | -7,390 | -8,646 | -9,122 | -9,059 | -8,678 | -9,177 | -9,402 | -8,001 |
| 2021 | -9,111 | -5,566 | -7,465 | -9,201 | -9,085 | -7,695 | -8,883 | -9,520 | -8,806 | -9,514 | -9,366 | -9,947 |
| 2022 | -9,247 | -8,432 | -7,967 | -8,100 | -8,413 | -9,087 | -8,298 | -8,622 | -9,171 | -9,385 | -9,605 | -8,686 |
| 2023 | -9,614 | -8,145 | -8,411 | -7,796 | -7,879 | -7,526 | -8,529 | -7,601 | -7,562 | -7,298 | -7,283 | -9,512 |
| 2024 | -8,719 | |||||||||||
| - = No Data Reported; -- = Not Applicable; NA = Not Available; W = Withheld to avoid disclosure of individual company data. |
| Release Date: 3/29/2024 |
| Next Release Date: 4/30/2024 |