|
Download Data (XLS File) |
|
||||||||
|
||||||||
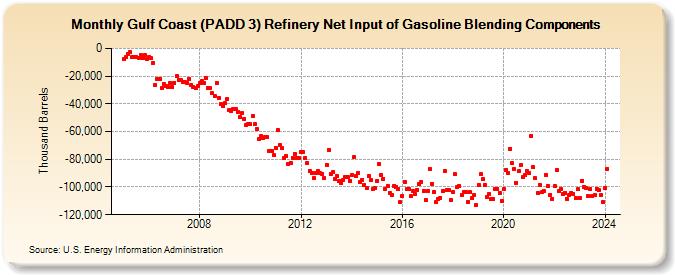
| Gulf Coast (PADD 3) Refinery Net Input of Gasoline Blending Components (Thousand Barrels) | ||||||||
| Year | Jan | Feb | Mar | Apr | May | Jun | Jul | Aug | Sep | Oct | Nov | Dec |
|---|---|---|---|---|---|---|---|---|---|---|---|---|
| 2005 | -7,928 | -6,404 | -3,947 | -2,695 | -6,335 | -6,266 | -6,241 | -6,769 | -4,956 | -6,909 | -4,805 | -7,338 |
| 2006 | -6,542 | -7,167 | -10,370 | -26,393 | -22,033 | -21,866 | -28,433 | -25,356 | -27,006 | -28,088 | -24,613 | -27,807 |
| 2007 | -24,619 | -20,112 | -22,685 | -22,652 | -24,190 | -24,216 | -24,791 | -21,772 | -26,085 | -27,907 | -28,909 | -27,220 |
| 2008 | -24,793 | -23,411 | -24,862 | -21,335 | -28,606 | -28,827 | -32,391 | -34,198 | -24,990 | -35,606 | -39,988 | -41,739 |
| 2009 | -39,705 | -36,617 | -44,177 | -45,198 | -43,944 | -43,934 | -45,663 | -49,382 | -46,552 | -50,648 | -54,964 | -54,836 |
| 2010 | -54,873 | -48,612 | -54,837 | -58,122 | -65,409 | -63,419 | -64,969 | -64,252 | -64,038 | -73,768 | -74,077 | -76,925 |
| 2011 | -71,731 | -59,205 | -69,475 | -72,021 | -78,870 | -77,465 | -83,545 | -82,438 | -78,850 | -75,864 | -78,861 | -79,260 |
| 2012 | -74,414 | -74,926 | -78,840 | -82,683 | -88,259 | -89,711 | -93,619 | -89,884 | -88,543 | -89,997 | -90,428 | -93,761 |
| 2013 | -83,967 | -73,277 | -90,941 | -89,303 | -94,477 | -92,240 | -95,790 | -97,442 | -94,734 | -92,674 | -92,729 | -95,538 |
| 2014 | -91,421 | -78,373 | -92,402 | -89,787 | -96,196 | -94,653 | -98,656 | -101,078 | -92,134 | -95,264 | -101,794 | -101,086 |
| 2015 | -95,384 | -83,119 | -91,102 | -93,896 | -101,131 | -99,322 | -103,998 | -105,635 | -99,061 | -99,710 | -101,216 | -111,045 |
| 2016 | -106,162 | -96,304 | -101,548 | -101,650 | -106,811 | -103,186 | -105,047 | -101,840 | -97,814 | -96,301 | -102,794 | -109,208 |
| 2017 | -102,591 | -86,990 | -97,557 | -103,501 | -110,563 | -108,367 | -107,643 | -103,180 | -88,221 | -101,953 | -102,437 | -109,465 |
| 2018 | -103,894 | -90,948 | -99,660 | -99,161 | -105,574 | -103,920 | -103,464 | -110,638 | -103,830 | -108,151 | -105,931 | -113,048 |
| 2019 | -98,426 | -90,861 | -94,567 | -98,201 | -107,373 | -104,737 | -108,983 | -108,680 | -101,227 | -101,116 | -104,178 | -110,105 |
| 2020 | -101,604 | -87,455 | -90,030 | -72,255 | -82,961 | -86,890 | -96,770 | -88,680 | -84,465 | -93,054 | -91,275 | -88,444 |
| 2021 | -90,128 | -63,282 | -85,817 | -93,851 | -104,337 | -98,270 | -103,867 | -103,201 | -91,173 | -99,140 | -105,513 | -108,616 |
| 2022 | -99,534 | -87,807 | -103,050 | -101,106 | -104,765 | -104,058 | -108,724 | -106,048 | -104,092 | -105,025 | -107,962 | -101,715 |
| 2023 | -107,829 | -95,389 | -99,984 | -100,425 | -106,532 | -101,542 | -106,634 | -105,666 | -101,134 | -101,958 | -105,607 | -111,125 |
| 2024 | -100,486 | |||||||||||
| - = No Data Reported; -- = Not Applicable; NA = Not Available; W = Withheld to avoid disclosure of individual company data. |
| Release Date: 3/29/2024 |
| Next Release Date: 4/30/2024 |