|
Download Data (XLS File) |
|
||||||||
|
||||||||
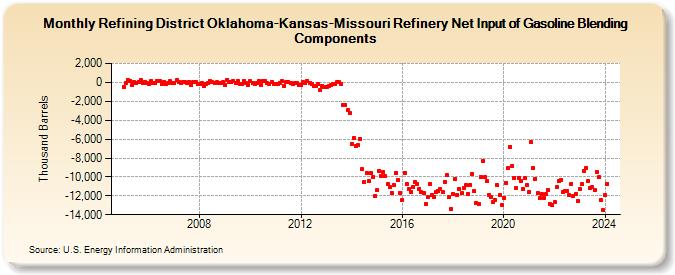
| Refining District Oklahoma-Kansas-Missouri Refinery Net Input of Gasoline Blending Components (Thousand Barrels) | ||||||||
| Year | Jan | Feb | Mar | Apr | May | Jun | Jul | Aug | Sep | Oct | Nov | Dec |
|---|---|---|---|---|---|---|---|---|---|---|---|---|
| 2005 | -497 | -66 | 231 | 174 | -289 | 34 | -87 | 71 | 296 | -16 | 41 | -85 |
| 2006 | -149 | 144 | -87 | -108 | 129 | 102 | -188 | 67 | -200 | -44 | 108 | -54 |
| 2007 | -63 | 206 | 47 | -105 | 64 | 40 | -82 | 35 | -321 | 35 | 67 | -200 |
| 2008 | -128 | -89 | -433 | -206 | -54 | 129 | -8 | -41 | 13 | -76 | -37 | -9 |
| 2009 | -264 | 257 | 32 | 22 | 127 | -76 | 189 | -162 | -162 | 179 | -74 | -248 |
| 2010 | 146 | -66 | -142 | -25 | 130 | -246 | 194 | 171 | -35 | -181 | 26 | -133 |
| 2011 | -180 | -163 | -23 | 104 | -373 | -7 | 46 | -88 | -188 | -70 | -77 | -316 |
| 2012 | -312 | -1 | -109 | 189 | -54 | -176 | -425 | -396 | -200 | -784 | -332 | -511 |
| 2013 | -460 | -395 | -306 | -149 | -130 | -6 | -8 | -160 | -2,409 | -2,419 | -2,932 | -3,264 |
| 2014 | -6,504 | -5,838 | -6,749 | -6,654 | -6,013 | -9,199 | -10,524 | -9,579 | -10,441 | -9,617 | -9,969 | -11,990 |
| 2015 | -11,436 | -9,326 | -9,883 | -9,530 | -9,942 | -10,764 | -11,093 | -11,700 | -10,818 | -9,541 | -10,316 | -11,705 |
| 2016 | -12,463 | -9,557 | -10,796 | -11,229 | -11,589 | -11,058 | -10,520 | -10,780 | -11,234 | -11,636 | -11,718 | -12,871 |
| 2017 | -12,122 | -10,727 | -11,928 | -12,092 | -11,619 | -11,540 | -11,287 | -11,557 | -10,492 | -9,837 | -12,079 | -13,422 |
| 2018 | -11,827 | -10,183 | -11,967 | -11,264 | -11,754 | -11,218 | -10,888 | -11,783 | -10,851 | -9,675 | -11,508 | -12,726 |
| 2019 | -12,858 | -9,969 | -8,329 | -10,030 | -10,453 | -11,890 | -12,169 | -12,698 | -12,491 | -10,883 | -11,927 | -12,923 |
| 2020 | -12,203 | -10,631 | -9,072 | -6,803 | -8,806 | -10,105 | -11,211 | -10,116 | -10,390 | -11,266 | -10,126 | -10,852 |
| 2021 | -11,547 | -6,322 | -9,058 | -10,194 | -11,754 | -12,215 | -11,828 | -12,259 | -11,857 | -11,338 | -12,916 | -12,986 |
| 2022 | -12,687 | -11,075 | -10,467 | -10,376 | -11,562 | -11,523 | -11,476 | -11,934 | -10,717 | -12,041 | -11,786 | -12,549 |
| 2023 | -11,230 | -10,784 | -9,369 | -9,042 | -10,381 | -11,123 | -11,116 | -11,416 | -9,437 | -10,019 | -12,493 | -13,529 |
| 2024 | -11,941 | |||||||||||
| - = No Data Reported; -- = Not Applicable; NA = Not Available; W = Withheld to avoid disclosure of individual company data. |
| Release Date: 3/29/2024 |
| Next Release Date: 4/30/2024 |