|
Download Data (XLS File) |
|
||||||||
|
||||||||
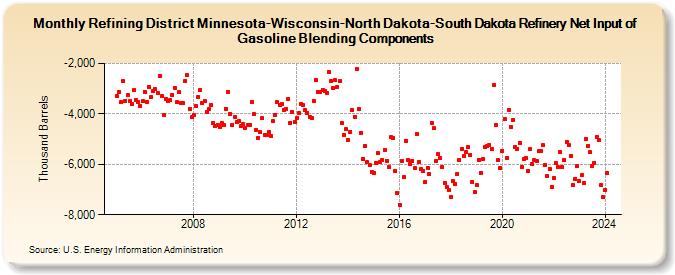
| Refining District Minnesota-Wisconsin-North Dakota-South Dakota Refinery Net Input of Gasoline Blending Components (Thousand Barrels) | ||||||||
| Year | Jan | Feb | Mar | Apr | May | Jun | Jul | Aug | Sep | Oct | Nov | Dec |
|---|---|---|---|---|---|---|---|---|---|---|---|---|
| 2005 | -3,306 | -3,127 | -3,540 | -2,710 | -3,470 | -3,264 | -3,507 | -3,620 | -3,060 | -3,455 | -3,517 | -3,681 |
| 2006 | -3,500 | -3,112 | -3,509 | -2,931 | -3,345 | -3,092 | -3,009 | -3,168 | -2,501 | -3,306 | -4,027 | -3,418 |
| 2007 | -3,488 | -3,460 | -3,238 | -2,966 | -3,543 | -3,149 | -3,554 | -3,587 | -2,696 | -2,476 | -3,797 | -4,137 |
| 2008 | -4,045 | -3,689 | -3,316 | -3,034 | -3,565 | -3,505 | -3,917 | -3,816 | -3,639 | -4,370 | -4,482 | -4,423 |
| 2009 | -4,527 | -4,362 | -4,456 | -3,788 | -3,147 | -3,988 | -4,443 | -4,117 | -4,315 | -4,301 | -4,493 | -4,407 |
| 2010 | -4,553 | -4,436 | -4,424 | -3,509 | -4,010 | -4,628 | -4,946 | -4,729 | -4,171 | -4,827 | -4,819 | -4,703 |
| 2011 | -4,867 | -4,292 | -4,031 | -3,530 | -3,644 | -3,620 | -3,833 | -3,805 | -3,401 | -4,360 | -3,929 | -4,315 |
| 2012 | -4,168 | -3,981 | -3,595 | -3,650 | -3,861 | -3,952 | -4,107 | -4,155 | -3,488 | -2,656 | -3,138 | -3,115 |
| 2013 | -3,047 | -3,084 | -3,152 | -2,334 | -2,712 | -2,975 | -2,673 | -2,941 | -2,693 | -4,376 | -4,826 | -4,619 |
| 2014 | -5,027 | -4,706 | -3,840 | -4,107 | -2,232 | -3,819 | -4,756 | -5,794 | -5,280 | -5,922 | -6,024 | -6,288 |
| 2015 | -6,339 | -5,936 | -5,542 | -5,918 | -5,830 | -5,421 | -5,852 | -6,117 | -4,932 | -4,948 | -6,264 | -7,150 |
| 2016 | -7,599 | -5,868 | -6,514 | -5,058 | -5,849 | -5,974 | -5,858 | -6,152 | -4,781 | -5,903 | -6,206 | -6,260 |
| 2017 | -6,689 | -6,133 | -6,375 | -4,348 | -4,577 | -5,869 | -5,605 | -5,755 | -6,098 | -6,727 | -6,905 | -7,015 |
| 2018 | -7,301 | -6,672 | -6,762 | -6,369 | -5,811 | -5,392 | -5,672 | -5,524 | -5,318 | -5,638 | -6,721 | -7,099 |
| 2019 | -6,837 | -5,817 | -6,330 | -5,776 | -5,312 | -5,274 | -5,217 | -5,395 | -2,852 | -4,426 | -5,848 | -6,136 |
| 2020 | -5,458 | -4,196 | -5,750 | -3,827 | -4,516 | -4,230 | -5,303 | -5,375 | -5,137 | -6,093 | -5,795 | -5,731 |
| 2021 | -6,267 | -5,407 | -5,990 | -5,848 | -5,861 | -5,491 | -5,462 | -5,252 | -6,037 | -6,459 | -6,173 | -6,917 |
| 2022 | -6,532 | -5,965 | -6,125 | -5,494 | -6,116 | -5,846 | -5,105 | -5,253 | -5,676 | -6,808 | -6,570 | -6,072 |
| 2023 | -6,677 | -6,444 | -6,731 | -4,979 | -5,265 | -5,530 | -6,053 | -5,934 | -4,917 | -5,046 | -6,824 | -7,311 |
| 2024 | -7,032 | -6,351 | -6,456 | -5,507 | -6,041 | -4,740 | ||||||
| - = No Data Reported; -- = Not Applicable; NA = Not Available; W = Withheld to avoid disclosure of individual company data. |
| Release Date: 8/30/2024 |
| Next Release Date: 9/30/2024 |