|
Download Data (XLS File) |
|
||||||||
|
||||||||
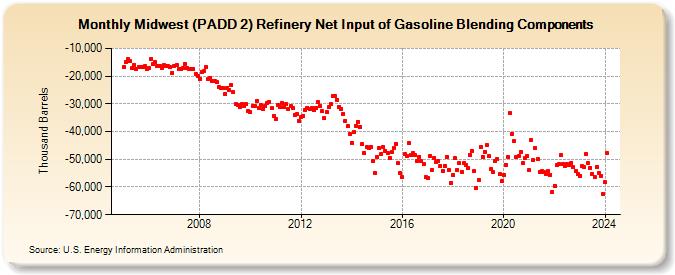
| Midwest (PADD 2) Refinery Net Input of Gasoline Blending Components (Thousand Barrels) | ||||||||
| Year | Jan | Feb | Mar | Apr | May | Jun | Jul | Aug | Sep | Oct | Nov | Dec |
|---|---|---|---|---|---|---|---|---|---|---|---|---|
| 2005 | -16,657 | -14,972 | -13,961 | -14,673 | -17,195 | -15,965 | -17,453 | -16,826 | -16,570 | -16,736 | -16,427 | -17,461 |
| 2006 | -17,178 | -13,842 | -15,575 | -14,942 | -16,201 | -16,188 | -17,047 | -15,930 | -16,405 | -16,389 | -16,824 | -18,847 |
| 2007 | -16,259 | -15,829 | -17,416 | -17,261 | -17,123 | -15,532 | -17,017 | -17,311 | -17,498 | -17,491 | -19,241 | -19,873 |
| 2008 | -21,010 | -18,575 | -18,169 | -16,733 | -20,991 | -20,506 | -21,845 | -21,719 | -22,197 | -23,930 | -24,292 | -24,377 |
| 2009 | -26,342 | -24,205 | -24,940 | -23,294 | -25,854 | -29,999 | -30,285 | -31,159 | -30,161 | -30,685 | -30,095 | -32,486 |
| 2010 | -33,088 | -30,673 | -30,794 | -28,928 | -31,608 | -30,533 | -31,943 | -30,942 | -29,866 | -29,297 | -31,605 | -34,305 |
| 2011 | -35,509 | -30,276 | -31,262 | -29,780 | -31,089 | -30,217 | -31,928 | -30,807 | -31,440 | -34,010 | -33,627 | -36,089 |
| 2012 | -34,740 | -34,218 | -32,045 | -31,399 | -31,853 | -31,363 | -32,278 | -31,447 | -29,239 | -30,626 | -32,765 | -35,028 |
| 2013 | -33,081 | -31,265 | -30,175 | -27,066 | -27,262 | -28,516 | -31,048 | -31,919 | -33,519 | -36,058 | -38,123 | -40,882 |
| 2014 | -43,968 | -40,179 | -37,876 | -36,458 | -38,231 | -44,493 | -47,854 | -45,621 | -46,010 | -45,462 | -50,590 | -55,065 |
| 2015 | -49,125 | -46,093 | -48,068 | -45,676 | -46,924 | -47,595 | -49,433 | -47,203 | -45,883 | -44,387 | -51,509 | -55,037 |
| 2016 | -56,553 | -48,239 | -48,766 | -44,217 | -48,535 | -47,736 | -48,482 | -50,515 | -49,039 | -50,780 | -51,879 | -56,468 |
| 2017 | -56,778 | -48,701 | -53,858 | -49,515 | -50,953 | -50,564 | -52,306 | -54,077 | -52,334 | -49,072 | -53,813 | -58,432 |
| 2018 | -55,651 | -49,713 | -53,870 | -51,319 | -54,530 | -51,501 | -52,042 | -53,143 | -48,404 | -46,855 | -54,409 | -60,358 |
| 2019 | -57,409 | -45,538 | -49,061 | -47,258 | -44,795 | -48,959 | -53,513 | -54,771 | -50,790 | -49,892 | -55,490 | -57,981 |
| 2020 | -55,746 | -51,913 | -49,073 | -33,381 | -40,827 | -43,540 | -49,153 | -48,943 | -47,206 | -51,323 | -49,507 | -48,654 |
| 2021 | -54,040 | -43,104 | -50,424 | -45,942 | -50,027 | -54,733 | -54,297 | -54,720 | -55,354 | -54,235 | -55,512 | -61,662 |
| 2022 | -59,599 | -52,141 | -51,885 | -48,515 | -51,662 | -52,329 | -51,762 | -52,070 | -51,247 | -52,903 | -54,380 | -55,253 |
| 2023 | -55,979 | -52,570 | -52,889 | -48,225 | -51,483 | -52,970 | -55,445 | -56,423 | -52,730 | -54,906 | -55,867 | -62,397 |
| 2024 | -58,376 | |||||||||||
| - = No Data Reported; -- = Not Applicable; NA = Not Available; W = Withheld to avoid disclosure of individual company data. |
| Release Date: 3/29/2024 |
| Next Release Date: 4/30/2024 |