|
Download Data (XLS File) |
|
||||||||
|
||||||||
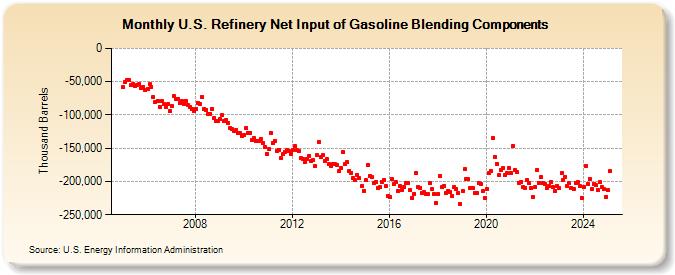
| U.S. Refinery Net Input of Gasoline Blending Components (Thousand Barrels) | ||||||||
| Year | Jan | Feb | Mar | Apr | May | Jun | Jul | Aug | Sep | Oct | Nov | Dec |
|---|---|---|---|---|---|---|---|---|---|---|---|---|
| 2005 | -58,723 | -50,666 | -47,565 | -48,146 | -55,526 | -53,818 | -57,022 | -54,599 | -52,910 | -59,159 | -57,849 | -62,864 |
| 2006 | -60,432 | -53,957 | -57,564 | -73,452 | -80,269 | -78,422 | -87,923 | -79,377 | -83,256 | -87,498 | -84,212 | -94,470 |
| 2007 | -86,458 | -71,872 | -76,498 | -75,442 | -82,256 | -79,437 | -84,245 | -78,744 | -84,654 | -87,522 | -90,614 | -94,603 |
| 2008 | -90,468 | -81,390 | -83,410 | -72,486 | -91,635 | -92,218 | -97,897 | -98,112 | -90,581 | -104,928 | -109,681 | -109,637 |
| 2009 | -106,774 | -100,564 | -108,668 | -106,896 | -111,587 | -119,541 | -120,795 | -123,794 | -122,314 | -127,910 | -127,780 | -131,426 |
| 2010 | -130,490 | -119,633 | -126,453 | -126,631 | -137,347 | -135,369 | -139,951 | -138,576 | -136,004 | -142,554 | -148,414 | -158,101 |
| 2011 | -151,400 | -127,158 | -141,981 | -138,731 | -153,721 | -152,049 | -164,788 | -158,837 | -155,853 | -152,899 | -154,378 | -158,044 |
| 2012 | -152,838 | -147,451 | -153,434 | -154,269 | -164,932 | -165,927 | -170,448 | -166,509 | -161,192 | -169,043 | -168,295 | -177,136 |
| 2013 | -160,361 | -140,544 | -163,949 | -160,534 | -168,762 | -166,719 | -174,094 | -176,749 | -173,453 | -174,200 | -175,052 | -184,567 |
| 2014 | -180,104 | -156,233 | -173,872 | -171,320 | -184,149 | -187,014 | -195,073 | -198,373 | -190,791 | -195,277 | -206,923 | -213,896 |
| 2015 | -198,322 | -175,251 | -191,613 | -192,959 | -202,130 | -200,875 | -210,155 | -208,767 | -200,429 | -197,584 | -207,255 | -221,675 |
| 2016 | -223,899 | -195,794 | -204,128 | -200,586 | -213,640 | -206,716 | -212,170 | -208,514 | -202,966 | -202,825 | -212,933 | -224,377 |
| 2017 | -218,488 | -186,643 | -208,294 | -209,687 | -217,819 | -216,101 | -218,619 | -219,524 | -202,399 | -211,861 | -218,595 | -232,364 |
| 2018 | -218,717 | -192,187 | -209,036 | -206,130 | -217,741 | -214,221 | -216,131 | -222,359 | -208,888 | -211,955 | -217,105 | -233,869 |
| 2019 | -214,410 | -181,934 | -196,766 | -197,022 | -209,707 | -210,333 | -217,251 | -216,974 | -202,974 | -203,901 | -214,613 | -225,121 |
| 2020 | -211,281 | -187,812 | -184,233 | -134,996 | -162,515 | -173,609 | -190,510 | -183,085 | -179,161 | -191,054 | -187,401 | -180,084 |
| 2021 | -187,930 | -146,607 | -182,693 | -186,328 | -201,894 | -200,738 | -208,453 | -209,418 | -197,401 | -202,502 | -210,101 | -223,087 |
| 2022 | -207,977 | -182,144 | -202,264 | -193,400 | -203,062 | -204,090 | -209,471 | -206,624 | -200,973 | -209,021 | -213,773 | -207,120 |
| 2023 | -210,329 | -187,538 | -197,437 | -193,561 | -206,560 | -202,400 | -210,149 | -211,944 | -201,735 | -201,335 | -206,213 | -224,390 |
| 2024 | -207,675 | |||||||||||
| - = No Data Reported; -- = Not Applicable; NA = Not Available; W = Withheld to avoid disclosure of individual company data. |
| Release Date: 3/29/2024 |
| Next Release Date: 4/30/2024 |