|
Download Data (XLS File) |
|
||||||||
|
||||||||
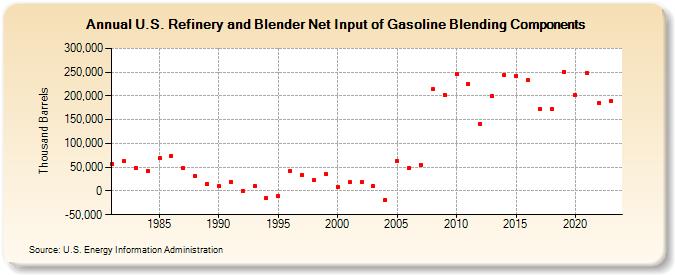
| U.S. Refinery and Blender Net Input of Gasoline Blending Components (Thousand Barrels) | ||||||||
| Decade | Year-0 | Year-1 | Year-2 | Year-3 | Year-4 | Year-5 | Year-6 | Year-7 | Year-8 | Year-9 |
|---|---|---|---|---|---|---|---|---|---|---|
| 1980's | 56,791 | 62,907 | 48,978 | 42,015 | 68,397 | 74,236 | 47,948 | 31,009 | 15,346 | |
| 1990's | 9,819 | 19,684 | -747 | 10,424 | -14,847 | -10,338 | 42,821 | 34,403 | 22,313 | 35,809 |
| 2000's | 9,317 | 18,285 | 19,239 | 10,020 | -18,558 | 63,202 | 48,416 | 55,325 | 213,533 | 201,993 |
| 2010's | 245,127 | 225,818 | 141,573 | 199,418 | 244,092 | 241,403 | 232,658 | 172,773 | 173,340 | 250,974 |
| 2020's | 201,900 | 247,582 | 186,108 | 188,310 |
| - = No Data Reported; -- = Not Applicable; NA = Not Available; W = Withheld to avoid disclosure of individual company data. |
| Release Date: 3/29/2024 |
| Next Release Date: 8/30/2024 |