|
Download Data (XLS File) |
|
||||||||
|
||||||||
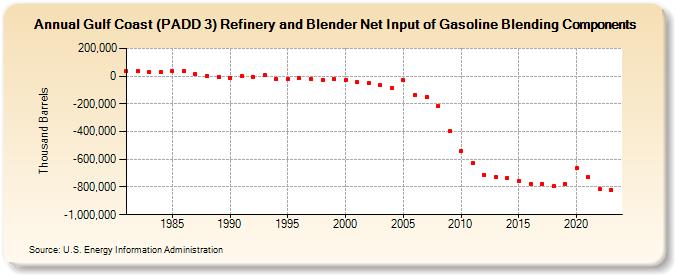
| Gulf Coast (PADD 3) Refinery and Blender Net Input of Gasoline Blending Components (Thousand Barrels) | ||||||||
| Decade | Year-0 | Year-1 | Year-2 | Year-3 | Year-4 | Year-5 | Year-6 | Year-7 | Year-8 | Year-9 |
|---|---|---|---|---|---|---|---|---|---|---|
| 1980's | 35,796 | 36,024 | 26,835 | 28,589 | 33,430 | 35,440 | 13,009 | 576 | -7,484 | |
| 1990's | -10,814 | -54 | -4,349 | 4,857 | -19,581 | -17,941 | -13,923 | -22,332 | -26,392 | -21,543 |
| 2000's | -31,109 | -45,010 | -51,771 | -66,390 | -82,277 | -31,201 | -132,887 | -149,562 | -215,079 | -396,805 |
| 2010's | -540,891 | -629,336 | -710,647 | -727,087 | -733,131 | -759,811 | -775,415 | -777,300 | -796,292 | -778,162 |
| 2020's | -666,304 | -729,664 | -816,238 | -820,632 |
| - = No Data Reported; -- = Not Applicable; NA = Not Available; W = Withheld to avoid disclosure of individual company data. |
| Release Date: 3/29/2024 |
| Next Release Date: 8/30/2024 |