|
Download Data (XLS File) |
|
||||||||
|
||||||||
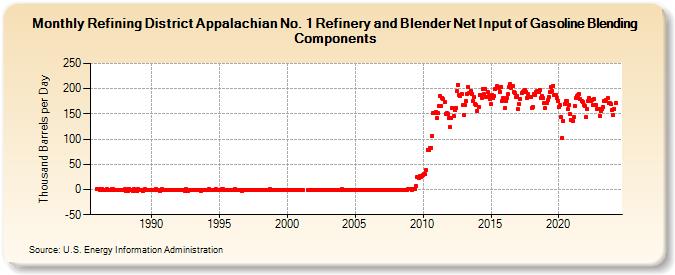
| Refining District Appalachian No. 1 Refinery and Blender Net Input of Gasoline Blending Components (Thousand Barrels per Day) | ||||||||
| Year | Jan | Feb | Mar | Apr | May | Jun | Jul | Aug | Sep | Oct | Nov | Dec |
|---|---|---|---|---|---|---|---|---|---|---|---|---|
| 1986 | 1 | 1 | 1 | -1 | 1 | 0 | 0 | 0 | 0 | 1 | -1 | 0 |
| 1987 | -1 | 1 | 1 | 0 | 0 | -1 | -1 | 0 | -1 | 0 | 0 | -1 |
| 1988 | 0 | 1 | -2 | -2 | 2 | 0 | 0 | -1 | -2 | 1 | -1 | -3 |
| 1989 | 1 | 0 | -1 | 0 | 0 | -3 | 1 | -1 | 0 | -1 | -1 | -1 |
| 1990 | 0 | -1 | -1 | 0 | 1 | -1 | 0 | 0 | -2 | 1 | 0 | -1 |
| 1991 | 0 | 0 | -1 | 0 | 0 | -1 | 0 | 0 | -1 | 0 | 0 | 0 |
| 1992 | -1 | 0 | 0 | 0 | -1 | -1 | -2 | 1 | -2 | 0 | -1 | 0 |
| 1993 | -1 | -1 | 0 | 0 | -1 | 0 | 0 | 0 | -2 | 0 | -1 | 0 |
| 1994 | -1 | -1 | 0 | 1 | -1 | -1 | 0 | -1 | -1 | 1 | -1 | 0 |
| 1995 | 0 | -1 | 1 | 1 | 0 | 0 | 0 | 0 | 0 | 0 | 0 | 0 |
| 1996 | -1 | 0 | 1 | 0 | -1 | -1 | 0 | -1 | -2 | 0 | 0 | -1 |
| 1997 | 0 | 0 | 0 | 0 | 0 | 0 | 0 | 0 | 0 | 0 | 0 | 0 |
| 1998 | 0 | 0 | 0 | 0 | -1 | 0 | -1 | 0 | 0 | 1 | -1 | 0 |
| 1999 | 0 | 0 | 0 | 0 | -1 | 0 | 0 | 0 | 0 | -1 | 0 | 0 |
| 2000 | 0 | 0 | -1 | 0 | 0 | 0 | 0 | 0 | 0 | 0 | -1 | 0 |
| 2001 | 0 | 0 | 0 | 0 | 0 | 0 | 0 | 0 | 0 | |||
| 2002 | 0 | 0 | 0 | 0 | 0 | 0 | 0 | 0 | 0 | 0 | -1 | 0 |
| 2003 | 0 | 0 | 0 | 0 | 0 | 0 | 0 | 0 | 0 | 0 | -1 | 0 |
| 2004 | 1 | 0 | 0 | -1 | 0 | 0 | 0 | 0 | 0 | 0 | 0 | 0 |
| 2005 | 0 | -1 | 0 | 0 | 0 | 0 | 0 | 0 | 0 | 0 | 0 | 0 |
| 2006 | 0 | 0 | 0 | 0 | 0 | 0 | 0 | 0 | 0 | 0 | 0 | 0 |
| 2007 | 0 | 0 | 0 | 0 | -1 | 0 | 0 | 0 | 0 | 0 | 0 | 0 |
| 2008 | 0 | 0 | 0 | 0 | 0 | 0 | 0 | -1 | 0 | 0 | 0 | 1 |
| 2009 | 1 | 1 | 0 | 1 | 1 | 2 | 7 | 25 | 23 | 27 | 25 | 26 |
| 2010 | 28 | 30 | 30 | 38 | 79 | 79 | 82 | 83 | 106 | 151 | 151 | 153 |
| 2011 | 141 | 152 | 165 | 185 | 166 | 182 | 179 | 173 | 150 | 151 | 149 | 142 |
| 2012 | 124 | 141 | 162 | 145 | 157 | 162 | 195 | 208 | 188 | 186 | 189 | 167 |
| 2013 | 148 | 167 | 175 | 190 | 203 | 191 | 196 | 189 | 176 | 183 | 170 | 168 |
| 2014 | 156 | 163 | 187 | 188 | 182 | 199 | 189 | 200 | 184 | 194 | 185 | 180 |
| 2015 | 169 | 188 | 182 | 185 | 200 | 205 | 203 | 202 | 194 | 204 | 176 | 182 |
| 2016 | 161 | 175 | 182 | 189 | 203 | 209 | 202 | 206 | 193 | 191 | 183 | 185 |
| 2017 | 159 | 170 | 180 | 191 | 194 | 196 | 198 | 193 | 181 | 189 | 184 | 183 |
| 2018 | 162 | 164 | 189 | 188 | 194 | 195 | 194 | 198 | 182 | 185 | 182 | 172 |
| 2019 | 161 | 172 | 177 | 184 | 193 | 204 | 196 | 206 | 187 | 188 | 181 | 176 |
| 2020 | 163 | 167 | 143 | 103 | 136 | 169 | 175 | 175 | 159 | 168 | 149 | 137 |
| 2021 | 136 | 144 | 166 | 181 | 185 | 188 | 190 | 180 | 175 | 174 | 167 | 166 |
| 2022 | 143 | 160 | 175 | 182 | 176 | 178 | 168 | 180 | 167 | 168 | 160 | 159 |
| 2023 | 149 | 157 | 161 | 167 | 179 | 180 | 178 | 181 | 168 | 171 | 169 | 157 |
| 2024 | 147 | 160 | 172 | 174 | 182 | 179 | ||||||
| - = No Data Reported; -- = Not Applicable; NA = Not Available; W = Withheld to avoid disclosure of individual company data. |
| Release Date: 8/30/2024 |
| Next Release Date: 9/30/2024 |