|
Download Data (XLS File) |
|
||||||||
|
||||||||
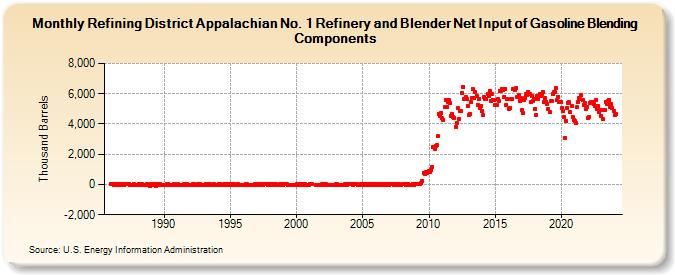
| Refining District Appalachian No. 1 Refinery and Blender Net Input of Gasoline Blending Components (Thousand Barrels) | ||||||||
| Year | Jan | Feb | Mar | Apr | May | Jun | Jul | Aug | Sep | Oct | Nov | Dec |
|---|---|---|---|---|---|---|---|---|---|---|---|---|
| 1986 | 31 | 16 | 22 | -38 | 26 | 5 | -12 | 2 | -7 | 14 | -17 | 4 |
| 1987 | -15 | 27 | 19 | 13 | 12 | -14 | -16 | -6 | -14 | 4 | -6 | -23 |
| 1988 | -10 | 29 | -49 | -55 | 46 | -7 | -3 | -23 | -58 | 38 | -35 | -78 |
| 1989 | 22 | 0 | -38 | -6 | 3 | -99 | 18 | -33 | 0 | -32 | -41 | -28 |
| 1990 | -4 | -16 | -31 | 2 | 18 | -23 | -9 | -12 | -57 | 28 | -9 | -15 |
| 1991 | -3 | 0 | -14 | -8 | -9 | -15 | 4 | -5 | -35 | 10 | -12 | -9 |
| 1992 | -32 | -4 | 6 | -2 | -14 | -15 | -62 | 20 | -53 | 0 | -28 | -12 |
| 1993 | -26 | -15 | 2 | -3 | -20 | 0 | 10 | -13 | -52 | 9 | -19 | -7 |
| 1994 | -39 | -15 | 9 | 36 | -33 | -18 | 6 | -36 | -39 | 15 | -39 | 5 |
| 1995 | -5 | -31 | 14 | 17 | -11 | -13 | -10 | -1 | -9 | -7 | -13 | -9 |
| 1996 | -41 | -4 | 15 | 7 | -21 | -31 | -3 | -19 | -50 | -12 | 0 | -16 |
| 1997 | 6 | -2 | 6 | -10 | -12 | -2 | -6 | 7 | 3 | 0 | -4 | 1 |
| 1998 | -6 | 2 | -3 | 3 | -14 | 1 | -15 | -4 | -8 | 20 | -15 | 10 |
| 1999 | -4 | 7 | -1 | -1 | -33 | -5 | -10 | -8 | -3 | -25 | -13 | -4 |
| 2000 | 2 | -3 | -20 | -1 | -7 | -2 | -11 | -6 | -1 | -11 | -20 | -7 |
| 2001 | 9 | -1 | 9 | -5 | -3 | -7 | -11 | -5 | -2 | |||
| 2002 | -3 | 1 | 6 | 2 | -10 | -4 | -5 | -9 | -5 | -9 | -28 | -6 |
| 2003 | 4 | 4 | -4 | -6 | -9 | -7 | -6 | -5 | 2 | -4 | -17 | 5 |
| 2004 | 19 | -1 | 1 | -28 | 11 | 3 | 3 | 2 | -5 | -14 | 4 | 2 |
| 2005 | 6 | -15 | 11 | -9 | 0 | 3 | -4 | 0 | -3 | 2 | -11 | 8 |
| 2006 | -8 | -7 | 13 | -1 | -7 | 2 | -3 | -3 | -2 | 0 | -5 | -2 |
| 2007 | -8 | -2 | 4 | 5 | -22 | 3 | 7 | -1 | -3 | 2 | -7 | -12 |
| 2008 | 2 | -1 | 6 | -4 | 1 | 7 | -7 | -16 | -9 | 9 | -6 | 20 |
| 2009 | 16 | 24 | 12 | 33 | 25 | 74 | 222 | 779 | 699 | 834 | 755 | 809 |
| 2010 | 879 | 849 | 941 | 1,145 | 2,446 | 2,363 | 2,548 | 2,586 | 3,175 | 4,689 | 4,538 | 4,750 |
| 2011 | 4,368 | 4,257 | 5,106 | 5,561 | 5,139 | 5,454 | 5,559 | 5,357 | 4,505 | 4,677 | 4,462 | 4,413 |
| 2012 | 3,830 | 4,090 | 5,026 | 4,362 | 4,871 | 4,854 | 6,034 | 6,461 | 5,640 | 5,752 | 5,681 | 5,162 |
| 2013 | 4,588 | 4,670 | 5,429 | 5,709 | 6,289 | 5,720 | 6,091 | 5,868 | 5,277 | 5,674 | 5,088 | 5,207 |
| 2014 | 4,828 | 4,574 | 5,787 | 5,627 | 5,655 | 5,980 | 5,869 | 6,197 | 5,511 | 5,999 | 5,561 | 5,581 |
| 2015 | 5,253 | 5,274 | 5,631 | 5,548 | 6,203 | 6,155 | 6,294 | 6,252 | 5,812 | 6,323 | 5,281 | 5,641 |
| 2016 | 4,983 | 5,066 | 5,651 | 5,672 | 6,281 | 6,280 | 6,277 | 6,394 | 5,792 | 5,913 | 5,499 | 5,736 |
| 2017 | 4,944 | 4,746 | 5,572 | 5,718 | 6,013 | 5,893 | 6,131 | 5,994 | 5,421 | 5,862 | 5,512 | 5,660 |
| 2018 | 5,013 | 4,604 | 5,851 | 5,649 | 6,001 | 5,848 | 6,009 | 6,136 | 5,457 | 5,729 | 5,471 | 5,338 |
| 2019 | 4,977 | 4,804 | 5,501 | 5,506 | 5,976 | 6,106 | 6,082 | 6,376 | 5,613 | 5,814 | 5,422 | 5,454 |
| 2020 | 5,040 | 4,850 | 4,446 | 3,083 | 4,227 | 5,062 | 5,417 | 5,421 | 4,767 | 5,217 | 4,480 | 4,262 |
| 2021 | 4,201 | 4,035 | 5,136 | 5,433 | 5,729 | 5,625 | 5,901 | 5,579 | 5,254 | 5,386 | 5,016 | 5,134 |
| 2022 | 4,428 | 4,477 | 5,417 | 5,465 | 5,448 | 5,347 | 5,206 | 5,584 | 5,016 | 5,199 | 4,793 | 4,934 |
| 2023 | 4,537 | 4,339 | 4,923 | 4,918 | 5,440 | 5,292 | 5,512 | 5,597 | 5,137 | 5,290 | 5,078 | 4,877 |
| 2024 | 4,562 | 4,632 | ||||||||||
| - = No Data Reported; -- = Not Applicable; NA = Not Available; W = Withheld to avoid disclosure of individual company data. |
| Release Date: 4/30/2024 |
| Next Release Date: 5/31/2024 |