|
Download Data (XLS File) |
|
||||||||
|
||||||||
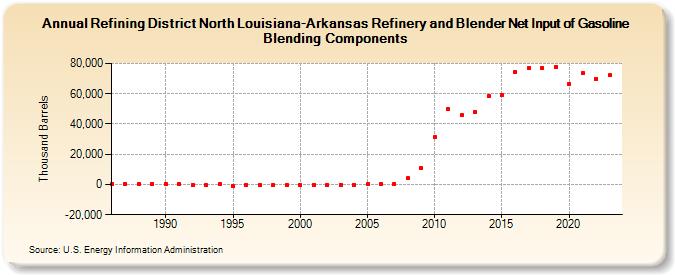
| Refining District North Louisiana-Arkansas Refinery and Blender Net Input of Gasoline Blending Components (Thousand Barrels) | ||||||||
| Decade | Year-0 | Year-1 | Year-2 | Year-3 | Year-4 | Year-5 | Year-6 | Year-7 | Year-8 | Year-9 |
|---|---|---|---|---|---|---|---|---|---|---|
| 1980's | 162 | 309 | 281 | 172 | ||||||
| 1990's | 98 | 52 | -282 | -530 | 53 | -853 | -209 | -395 | -192 | -232 |
| 2000's | -341 | -90 | -194 | -95 | -85 | 42 | 18 | 462 | 4,035 | 10,697 |
| 2010's | 31,137 | 50,052 | 45,756 | 48,134 | 58,418 | 58,921 | 74,529 | 76,898 | 77,063 | 77,872 |
| 2020's | 66,333 | 73,649 | 70,011 | 72,137 |
| - = No Data Reported; -- = Not Applicable; NA = Not Available; W = Withheld to avoid disclosure of individual company data. |
| Release Date: 3/29/2024 |
| Next Release Date: 8/30/2024 |