|
Download Data (XLS File) |
|
||||||||
|
||||||||
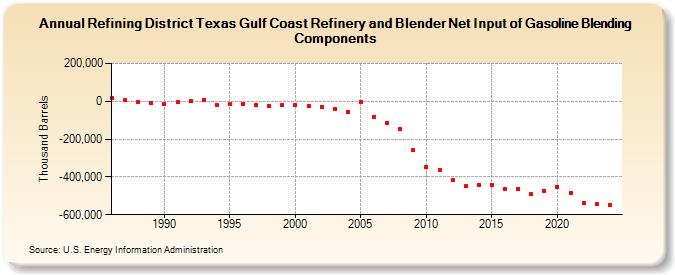
| Refining District Texas Gulf Coast Refinery and Blender Net Input of Gasoline Blending Components (Thousand Barrels) | ||||||||
| Decade | Year-0 | Year-1 | Year-2 | Year-3 | Year-4 | Year-5 | Year-6 | Year-7 | Year-8 | Year-9 |
|---|---|---|---|---|---|---|---|---|---|---|
| 1980's | 17,876 | 6,762 | -5,916 | -10,363 | ||||||
| 1990's | -15,696 | -5,200 | -592 | 7,999 | -21,721 | -14,091 | -15,309 | -19,448 | -23,645 | -20,688 |
| 2000's | -22,252 | -27,486 | -29,784 | -42,875 | -55,521 | -3,436 | -81,988 | -113,142 | -146,575 | -259,279 |
| 2010's | -345,603 | -361,051 | -415,157 | -449,371 | -442,512 | -440,266 | -463,992 | -463,576 | -492,039 | -473,043 |
| 2020's | -451,801 | -483,405 | -536,048 | -545,521 |
| - = No Data Reported; -- = Not Applicable; NA = Not Available; W = Withheld to avoid disclosure of individual company data. |
| Release Date: 3/29/2024 |
| Next Release Date: 8/30/2024 |