|
Download Data (XLS File) |
|
||||||||
|
||||||||
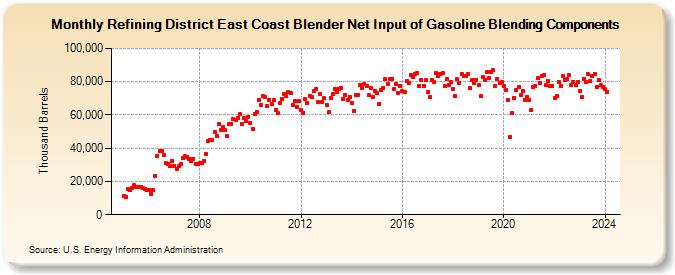
| Refining District East Coast Blender Net Input of Gasoline Blending Components (Thousand Barrels) | ||||||||
| Year | Jan | Feb | Mar | Apr | May | Jun | Jul | Aug | Sep | Oct | Nov | Dec |
|---|---|---|---|---|---|---|---|---|---|---|---|---|
| 2005 | 11,440 | 10,866 | 15,415 | 14,952 | 16,160 | 17,608 | 16,412 | 16,897 | 16,532 | 15,778 | 15,602 | 14,912 |
| 2006 | 14,976 | 12,428 | 14,605 | 23,536 | 35,451 | 38,127 | 38,295 | 36,125 | 30,872 | 30,359 | 29,540 | 32,150 |
| 2007 | 29,340 | 27,494 | 29,091 | 30,207 | 34,212 | 35,203 | 34,777 | 33,756 | 32,286 | 33,574 | 30,314 | 30,537 |
| 2008 | 31,029 | 31,187 | 32,591 | 36,597 | 44,425 | 44,739 | 44,882 | 49,657 | 47,255 | 54,627 | 50,715 | 52,849 |
| 2009 | 50,634 | 47,288 | 54,354 | 54,590 | 57,380 | 57,094 | 58,364 | 60,515 | 54,723 | 58,245 | 56,129 | 59,040 |
| 2010 | 55,248 | 51,686 | 60,569 | 62,050 | 69,168 | 66,216 | 71,430 | 70,958 | 65,282 | 69,138 | 66,276 | 68,927 |
| 2011 | 62,805 | 60,982 | 67,015 | 69,758 | 72,789 | 71,117 | 73,749 | 73,244 | 66,193 | 68,175 | 64,938 | 68,240 |
| 2012 | 62,659 | 61,421 | 69,626 | 67,026 | 71,477 | 70,822 | 74,110 | 75,865 | 68,000 | 72,514 | 68,018 | 69,898 |
| 2013 | 66,191 | 61,501 | 69,911 | 72,518 | 75,804 | 74,037 | 75,835 | 76,309 | 69,427 | 72,133 | 68,980 | 70,913 |
| 2014 | 67,074 | 62,396 | 71,719 | 72,067 | 78,272 | 76,026 | 78,429 | 77,599 | 71,797 | 76,213 | 70,874 | 74,519 |
| 2015 | 73,106 | 66,538 | 74,835 | 76,188 | 81,432 | 78,789 | 81,613 | 81,744 | 75,698 | 78,613 | 73,444 | 77,595 |
| 2016 | 74,126 | 73,928 | 80,460 | 79,148 | 83,836 | 82,793 | 84,378 | 85,267 | 77,658 | 81,211 | 77,627 | 80,759 |
| 2017 | 73,864 | 70,695 | 80,805 | 79,526 | 85,080 | 83,235 | 84,303 | 85,325 | 77,292 | 81,826 | 78,023 | 79,857 |
| 2018 | 75,582 | 71,228 | 81,383 | 79,438 | 84,602 | 83,100 | 83,413 | 84,711 | 76,206 | 81,272 | 78,904 | 81,078 |
| 2019 | 78,029 | 71,348 | 83,096 | 80,941 | 85,863 | 82,096 | 85,835 | 86,709 | 77,368 | 81,883 | 79,458 | 79,493 |
| 2020 | 77,498 | 74,949 | 69,151 | 46,580 | 61,150 | 70,198 | 74,974 | 76,671 | 72,042 | 74,610 | 68,930 | 70,546 |
| 2021 | 69,213 | 63,237 | 76,627 | 77,462 | 82,024 | 79,263 | 83,687 | 83,722 | 77,717 | 80,272 | 77,405 | 77,187 |
| 2022 | 70,467 | 71,314 | 79,726 | 77,553 | 83,513 | 80,759 | 81,564 | 83,745 | 78,083 | 80,015 | 77,785 | 79,934 |
| 2023 | 74,581 | 71,024 | 81,878 | 79,678 | 84,493 | 80,189 | 83,412 | 84,738 | 76,956 | 81,090 | 77,743 | 77,018 |
| 2024 | 75,577 | |||||||||||
| - = No Data Reported; -- = Not Applicable; NA = Not Available; W = Withheld to avoid disclosure of individual company data. |
| Release Date: 3/29/2024 |
| Next Release Date: 4/30/2024 |