|
Download Data (XLS File) |
|
||||||||
|
||||||||
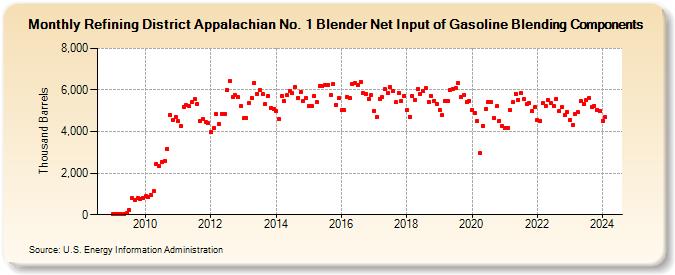
| Refining District Appalachian No. 1 Blender Net Input of Gasoline Blending Components (Thousand Barrels) | ||||||||
| Year | Jan | Feb | Mar | Apr | May | Jun | Jul | Aug | Sep | Oct | Nov | Dec |
|---|---|---|---|---|---|---|---|---|---|---|---|---|
| 2009 | 13 | 25 | 20 | 29 | 30 | 67 | 218 | 783 | 709 | 819 | 756 | 813 |
| 2010 | 879 | 841 | 952 | 1,123 | 2,447 | 2,360 | 2,548 | 2,581 | 3,180 | 4,805 | 4,565 | 4,715 |
| 2011 | 4,490 | 4,271 | 5,199 | 5,267 | 5,211 | 5,405 | 5,549 | 5,324 | 4,509 | 4,601 | 4,476 | 4,388 |
| 2012 | 3,956 | 4,158 | 4,827 | 4,356 | 4,850 | 4,861 | 6,007 | 6,421 | 5,656 | 5,736 | 5,659 | 5,218 |
| 2013 | 4,629 | 4,668 | 5,380 | 5,631 | 6,353 | 5,827 | 6,006 | 5,804 | 5,325 | 5,704 | 5,124 | 5,076 |
| 2014 | 4,965 | 4,595 | 5,700 | 5,465 | 5,744 | 5,966 | 5,843 | 6,150 | 5,624 | 5,917 | 5,492 | 5,620 |
| 2015 | 5,214 | 5,223 | 5,727 | 5,404 | 6,210 | 6,184 | 6,234 | 6,254 | 5,769 | 6,296 | 5,289 | 5,591 |
| 2016 | 5,036 | 5,025 | 5,650 | 5,606 | 6,296 | 6,321 | 6,227 | 6,390 | 5,831 | 5,813 | 5,577 | 5,740 |
| 2017 | 4,996 | 4,698 | 5,584 | 5,647 | 6,028 | 5,857 | 6,130 | 5,946 | 5,408 | 5,864 | 5,491 | 5,717 |
| 2018 | 5,037 | 4,716 | 5,723 | 5,519 | 6,058 | 5,821 | 5,959 | 6,090 | 5,428 | 5,718 | 5,486 | 5,347 |
| 2019 | 5,051 | 4,786 | 5,466 | 5,461 | 5,994 | 6,068 | 6,074 | 6,339 | 5,652 | 5,753 | 5,424 | 5,492 |
| 2020 | 5,051 | 4,910 | 4,498 | 2,947 | 4,260 | 5,094 | 5,410 | 5,416 | 4,654 | 5,205 | 4,520 | 4,267 |
| 2021 | 4,160 | 4,184 | 5,045 | 5,403 | 5,830 | 5,531 | 5,862 | 5,572 | 5,307 | 5,363 | 4,970 | 5,165 |
| 2022 | 4,550 | 4,513 | 5,352 | 5,209 | 5,520 | 5,365 | 5,234 | 5,585 | 4,977 | 5,171 | 4,791 | 4,950 |
| 2023 | 4,570 | 4,324 | 4,857 | 4,922 | 5,477 | 5,307 | 5,516 | 5,591 | 5,170 | 5,247 | 5,035 | 4,980 |
| 2024 | 4,531 | |||||||||||
| - = No Data Reported; -- = Not Applicable; NA = Not Available; W = Withheld to avoid disclosure of individual company data. |
| Release Date: 3/29/2024 |
| Next Release Date: 4/30/2024 |