|
Download Data (XLS File) |
|
||||||||
|
||||||||
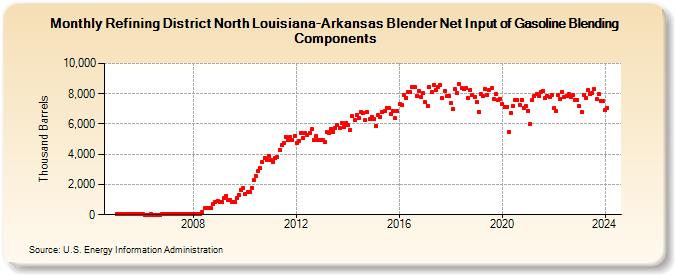
| Refining District North Louisiana-Arkansas Blender Net Input of Gasoline Blending Components (Thousand Barrels) | ||||||||
| Year | Jan | Feb | Mar | Apr | May | Jun | Jul | Aug | Sep | Oct | Nov | Dec |
|---|---|---|---|---|---|---|---|---|---|---|---|---|
| 2005 | 19 | 16 | 24 | 22 | 22 | 21 | 17 | 18 | 18 | 19 | 19 | 18 |
| 2006 | 17 | 13 | 14 | 10 | 15 | 12 | 13 | 13 | 14 | 17 | 21 | 22 |
| 2007 | 35 | 34 | 41 | 22 | 43 | 26 | 37 | 50 | 55 | 66 | 78 | 76 |
| 2008 | 50 | 40 | 34 | 32 | 209 | 431 | 457 | 436 | 414 | 705 | 843 | 931 |
| 2009 | 857 | 833 | 1,080 | 1,223 | 948 | 943 | 862 | 841 | 1,104 | 1,297 | 1,641 | 1,756 |
| 2010 | 1,353 | 1,531 | 1,501 | 1,782 | 2,271 | 2,553 | 2,868 | 3,084 | 3,471 | 3,763 | 3,617 | 3,908 |
| 2011 | 3,596 | 3,508 | 3,761 | 3,784 | 4,308 | 4,610 | 4,751 | 5,162 | 4,926 | 5,138 | 4,913 | 5,214 |
| 2012 | 4,716 | 4,872 | 5,413 | 5,084 | 5,398 | 5,287 | 5,399 | 5,644 | 4,909 | 5,204 | 4,925 | 4,971 |
| 2013 | 4,912 | 4,806 | 5,479 | 5,407 | 5,666 | 5,491 | 5,728 | 5,902 | 5,730 | 6,066 | 5,831 | 6,051 |
| 2014 | 5,931 | 5,609 | 6,504 | 6,236 | 6,607 | 6,428 | 6,820 | 6,735 | 6,233 | 6,789 | 6,318 | 6,483 |
| 2015 | 6,331 | 5,836 | 6,562 | 6,468 | 6,788 | 6,871 | 7,086 | 7,074 | 6,627 | 6,881 | 6,363 | 6,873 |
| 2016 | 7,297 | 7,265 | 7,885 | 7,750 | 8,115 | 8,125 | 8,453 | 8,454 | 7,874 | 8,172 | 7,799 | 8,029 |
| 2017 | 7,432 | 7,214 | 8,465 | 8,114 | 8,577 | 8,272 | 8,457 | 8,605 | 7,694 | 8,193 | 7,825 | 7,862 |
| 2018 | 7,375 | 6,998 | 8,296 | 8,019 | 8,613 | 8,351 | 8,310 | 8,376 | 7,708 | 8,265 | 7,884 | 7,795 |
| 2019 | 7,444 | 6,822 | 7,960 | 7,839 | 8,307 | 7,922 | 8,270 | 8,351 | 7,673 | 7,998 | 7,560 | 7,684 |
| 2020 | 7,332 | 7,092 | 7,132 | 5,458 | 6,718 | 7,206 | 7,601 | 7,580 | 7,278 | 7,614 | 7,070 | 7,179 |
| 2021 | 6,879 | 6,002 | 7,604 | 7,852 | 7,972 | 7,882 | 8,133 | 8,188 | 7,687 | 7,838 | 7,776 | 7,918 |
| 2022 | 7,050 | 6,845 | 7,936 | 7,659 | 8,143 | 7,791 | 7,871 | 7,957 | 7,809 | 7,885 | 7,561 | 7,592 |
| 2023 | 7,160 | 6,808 | 7,899 | 7,725 | 8,226 | 7,956 | 8,022 | 8,279 | 7,631 | 7,951 | 7,516 | 7,499 |
| 2024 | 6,892 | 7,085 | 7,649 | 7,664 | 8,037 | 7,615 | ||||||
| - = No Data Reported; -- = Not Applicable; NA = Not Available; W = Withheld to avoid disclosure of individual company data. |
| Release Date: 8/30/2024 |
| Next Release Date: 9/30/2024 |