|
Download Data (XLS File) |
|
||||||||
|
||||||||
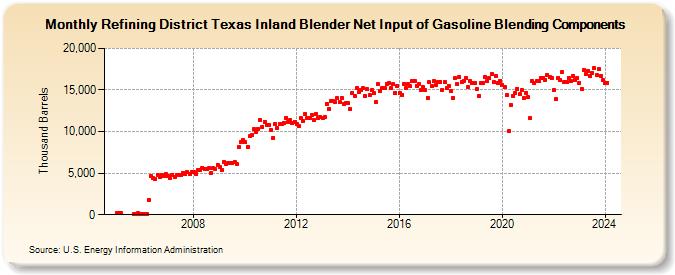
| Refining District Texas Inland Blender Net Input of Gasoline Blending Components (Thousand Barrels) | ||||||||
| Year | Jan | Feb | Mar | Apr | May | Jun | Jul | Aug | Sep | Oct | Nov | Dec |
|---|---|---|---|---|---|---|---|---|---|---|---|---|
| 2005 | 161 | 148 | 148 | 68 | 105 | 155 | 79 | |||||
| 2006 | 115 | 71 | 119 | 1,786 | 4,680 | 4,366 | 4,286 | 4,814 | 4,496 | 4,811 | 4,597 | 4,874 |
| 2007 | 4,604 | 4,461 | 4,800 | 4,521 | 4,775 | 4,800 | 4,793 | 5,066 | 4,863 | 5,130 | 4,914 | 5,157 |
| 2008 | 5,111 | 4,901 | 5,318 | 5,378 | 5,659 | 5,515 | 5,467 | 5,591 | 5,060 | 5,566 | 5,498 | 5,998 |
| 2009 | 5,700 | 5,379 | 6,337 | 6,068 | 6,244 | 6,274 | 6,172 | 6,357 | 6,083 | 8,114 | 8,753 | 9,019 |
| 2010 | 8,686 | 8,154 | 9,418 | 9,559 | 10,271 | 9,938 | 10,254 | 11,400 | 10,599 | 11,193 | 10,768 | 10,799 |
| 2011 | 10,211 | 9,281 | 10,915 | 10,432 | 10,857 | 10,895 | 11,076 | 11,665 | 11,124 | 11,418 | 11,024 | 11,201 |
| 2012 | 10,886 | 10,615 | 11,595 | 11,262 | 12,096 | 11,679 | 11,616 | 12,022 | 11,417 | 12,097 | 11,589 | 11,698 |
| 2013 | 11,688 | 11,693 | 13,342 | 12,756 | 13,648 | 13,642 | 13,565 | 13,981 | 13,499 | 14,058 | 13,373 | 13,408 |
| 2014 | 13,384 | 12,680 | 14,669 | 14,325 | 15,179 | 14,751 | 15,031 | 15,192 | 14,270 | 15,098 | 14,374 | 14,965 |
| 2015 | 14,577 | 13,563 | 15,722 | 14,916 | 15,235 | 15,297 | 15,720 | 15,849 | 15,221 | 15,665 | 14,665 | 15,494 |
| 2016 | 14,673 | 14,431 | 15,745 | 15,191 | 15,775 | 15,425 | 16,114 | 16,042 | 15,506 | 15,689 | 15,015 | 15,303 |
| 2017 | 14,949 | 14,067 | 15,921 | 15,487 | 16,037 | 15,581 | 16,002 | 15,968 | 15,045 | 15,936 | 15,220 | 15,526 |
| 2018 | 14,841 | 14,055 | 16,405 | 15,678 | 16,611 | 15,968 | 16,066 | 16,478 | 15,376 | 16,070 | 15,887 | 15,868 |
| 2019 | 15,123 | 14,314 | 15,813 | 15,844 | 16,581 | 16,069 | 16,406 | 16,895 | 15,969 | 16,696 | 15,888 | 16,136 |
| 2020 | 15,550 | 15,376 | 14,374 | 10,092 | 13,199 | 14,292 | 14,673 | 15,156 | 14,471 | 14,988 | 14,064 | 14,650 |
| 2021 | 14,095 | 11,576 | 16,048 | 15,809 | 16,057 | 16,108 | 16,466 | 16,485 | 16,240 | 16,773 | 16,547 | 16,432 |
| 2022 | 14,988 | 13,900 | 16,453 | 16,219 | 17,171 | 15,900 | 15,962 | 16,455 | 16,056 | 16,724 | 16,217 | 16,436 |
| 2023 | 15,883 | 15,088 | 17,375 | 16,928 | 17,297 | 16,631 | 17,081 | 17,648 | 16,746 | 17,502 | 16,670 | 16,176 |
| 2024 | 15,884 | |||||||||||
| - = No Data Reported; -- = Not Applicable; NA = Not Available; W = Withheld to avoid disclosure of individual company data. |
| Release Date: 3/29/2024 |
| Next Release Date: 4/30/2024 |