|
Download Data (XLS File) |
|
||||||||
|
||||||||
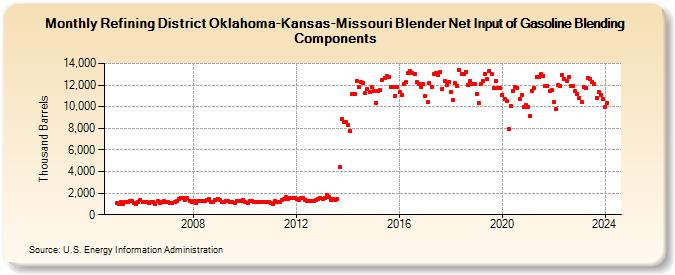
| Refining District Oklahoma-Kansas-Missouri Blender Net Input of Gasoline Blending Components (Thousand Barrels) | ||||||||
| Year | Jan | Feb | Mar | Apr | May | Jun | Jul | Aug | Sep | Oct | Nov | Dec |
|---|---|---|---|---|---|---|---|---|---|---|---|---|
| 2005 | 1,074 | 978 | 1,166 | 1,031 | 1,181 | 1,151 | 1,224 | 1,248 | 1,072 | 968 | 1,187 | 1,365 |
| 2006 | 1,144 | 1,175 | 1,144 | 1,065 | 1,185 | 1,212 | 1,038 | 1,227 | 1,101 | 1,179 | 1,226 | 1,167 |
| 2007 | 1,151 | 1,073 | 1,105 | 1,172 | 1,247 | 1,492 | 1,568 | 1,548 | 1,382 | 1,537 | 1,273 | 1,189 |
| 2008 | 1,246 | 1,120 | 1,269 | 1,250 | 1,265 | 1,237 | 1,345 | 1,436 | 1,199 | 1,211 | 1,349 | 1,462 |
| 2009 | 1,358 | 1,161 | 1,196 | 1,244 | 1,229 | 1,190 | 1,168 | 1,110 | 1,227 | 1,260 | 1,229 | 1,378 |
| 2010 | 1,214 | 1,103 | 1,242 | 1,268 | 1,217 | 1,161 | 1,167 | 1,187 | 1,155 | 1,192 | 1,211 | 1,218 |
| 2011 | 1,117 | 999 | 1,250 | 1,220 | 1,145 | 1,372 | 1,412 | 1,652 | 1,443 | 1,553 | 1,542 | 1,540 |
| 2012 | 1,433 | 1,389 | 1,541 | 1,548 | 1,382 | 1,306 | 1,283 | 1,277 | 1,249 | 1,359 | 1,490 | 1,537 |
| 2013 | 1,496 | 1,517 | 1,822 | 1,686 | 1,328 | 1,429 | 1,398 | 1,446 | 4,411 | 8,894 | 8,616 | 8,539 |
| 2014 | 8,273 | 7,710 | 11,166 | 11,150 | 12,413 | 11,838 | 12,263 | 12,199 | 11,304 | 11,643 | 11,364 | 11,788 |
| 2015 | 11,408 | 10,385 | 11,435 | 11,515 | 12,488 | 12,640 | 12,845 | 12,794 | 11,798 | 11,858 | 11,023 | 11,865 |
| 2016 | 11,338 | 11,116 | 12,059 | 12,254 | 13,087 | 13,263 | 13,126 | 13,027 | 12,254 | 12,146 | 11,866 | 12,100 |
| 2017 | 11,029 | 10,419 | 12,233 | 11,835 | 13,029 | 13,117 | 12,915 | 13,211 | 11,665 | 12,359 | 11,974 | 12,279 |
| 2018 | 11,358 | 10,603 | 12,180 | 11,948 | 13,387 | 13,060 | 13,036 | 13,219 | 11,987 | 12,415 | 12,071 | 12,101 |
| 2019 | 11,198 | 10,310 | 12,125 | 12,381 | 13,012 | 12,538 | 13,337 | 13,061 | 11,714 | 12,349 | 11,716 | 11,727 |
| 2020 | 11,050 | 10,748 | 10,502 | 7,927 | 10,051 | 11,495 | 11,866 | 11,768 | 10,706 | 11,120 | 9,999 | 10,151 |
| 2021 | 9,979 | 9,137 | 11,485 | 11,695 | 12,793 | 12,738 | 12,999 | 12,865 | 11,875 | 11,943 | 11,488 | 11,560 |
| 2022 | 10,404 | 9,792 | 11,975 | 11,872 | 12,930 | 12,570 | 12,367 | 12,781 | 11,892 | 11,919 | 11,424 | 11,188 |
| 2023 | 10,827 | 10,395 | 11,791 | 11,725 | 12,698 | 12,567 | 12,310 | 12,081 | 10,828 | 11,346 | 11,062 | 10,706 |
| 2024 | 10,007 | |||||||||||
| - = No Data Reported; -- = Not Applicable; NA = Not Available; W = Withheld to avoid disclosure of individual company data. |
| Release Date: 3/29/2024 |
| Next Release Date: 4/30/2024 |