|
Download Data (XLS File) |
|
||||||||
|
||||||||
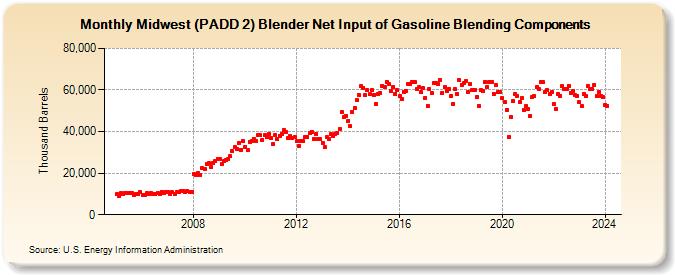
| Midwest (PADD 2) Blender Net Input of Gasoline Blending Components (Thousand Barrels) | ||||||||
| Year | Jan | Feb | Mar | Apr | May | Jun | Jul | Aug | Sep | Oct | Nov | Dec |
|---|---|---|---|---|---|---|---|---|---|---|---|---|
| 2005 | 9,818 | 9,174 | 10,411 | 9,748 | 10,433 | 10,389 | 10,410 | 10,550 | 9,552 | 10,037 | 10,039 | 10,858 |
| 2006 | 9,686 | 9,639 | 10,468 | 9,994 | 10,433 | 10,167 | 9,841 | 10,387 | 9,747 | 11,103 | 10,209 | 10,912 |
| 2007 | 10,699 | 9,910 | 10,713 | 10,143 | 10,824 | 11,108 | 11,186 | 11,484 | 11,036 | 11,362 | 11,059 | 11,097 |
| 2008 | 19,664 | 19,040 | 19,956 | 19,180 | 22,268 | 22,066 | 24,161 | 24,744 | 22,934 | 24,903 | 25,819 | 26,867 |
| 2009 | 26,852 | 24,568 | 25,686 | 26,447 | 26,906 | 28,092 | 30,432 | 32,429 | 31,669 | 34,587 | 31,338 | 35,412 |
| 2010 | 32,781 | 31,314 | 35,013 | 35,264 | 36,591 | 35,636 | 38,273 | 38,185 | 36,140 | 38,182 | 37,432 | 38,976 |
| 2011 | 37,016 | 34,131 | 38,250 | 36,354 | 38,002 | 38,984 | 40,683 | 39,730 | 36,682 | 37,918 | 36,898 | 37,558 |
| 2012 | 35,261 | 33,213 | 35,355 | 35,393 | 37,342 | 37,460 | 39,346 | 39,917 | 36,434 | 38,830 | 36,426 | 36,340 |
| 2013 | 34,623 | 32,335 | 37,272 | 36,249 | 38,666 | 37,869 | 38,703 | 39,398 | 41,282 | 49,305 | 46,819 | 47,611 |
| 2014 | 45,226 | 42,481 | 49,566 | 51,306 | 55,114 | 57,734 | 61,739 | 61,072 | 57,366 | 59,884 | 57,913 | 60,099 |
| 2015 | 57,789 | 53,282 | 58,246 | 58,568 | 62,146 | 61,283 | 64,006 | 62,839 | 59,298 | 61,504 | 58,212 | 59,826 |
| 2016 | 56,980 | 55,559 | 59,219 | 59,619 | 62,774 | 62,846 | 63,801 | 63,979 | 60,364 | 61,301 | 59,079 | 60,749 |
| 2017 | 56,159 | 52,469 | 60,582 | 58,453 | 63,377 | 63,178 | 62,969 | 64,616 | 58,672 | 61,395 | 59,488 | 60,587 |
| 2018 | 56,997 | 53,275 | 60,339 | 58,176 | 64,564 | 62,555 | 63,425 | 64,221 | 58,981 | 62,732 | 59,957 | 60,044 |
| 2019 | 56,556 | 52,388 | 59,800 | 59,419 | 64,030 | 61,569 | 64,061 | 63,985 | 58,237 | 62,219 | 58,876 | 58,786 |
| 2020 | 56,099 | 54,141 | 50,513 | 37,464 | 46,960 | 54,516 | 58,061 | 57,172 | 54,076 | 56,084 | 50,501 | 52,314 |
| 2021 | 51,035 | 47,609 | 56,660 | 57,088 | 61,420 | 60,567 | 63,823 | 63,685 | 59,162 | 59,866 | 58,098 | 58,990 |
| 2022 | 53,370 | 51,053 | 58,226 | 57,259 | 61,830 | 60,311 | 60,637 | 62,042 | 58,595 | 59,620 | 57,390 | 57,222 |
| 2023 | 54,158 | 52,125 | 58,160 | 57,093 | 62,094 | 60,500 | 60,511 | 62,344 | 57,171 | 59,232 | 56,998 | 56,520 |
| 2024 | 52,919 | |||||||||||
| - = No Data Reported; -- = Not Applicable; NA = Not Available; W = Withheld to avoid disclosure of individual company data. |
| Release Date: 3/29/2024 |
| Next Release Date: 4/30/2024 |