|
Download Data (XLS File) |
|
||||||||
|
||||||||
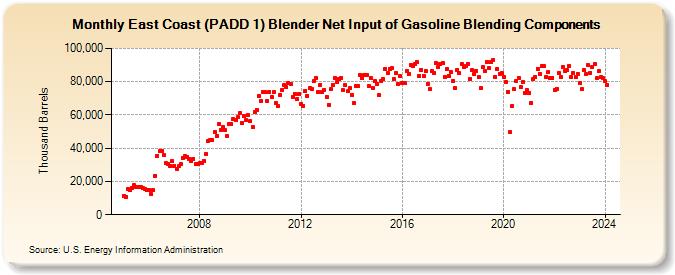
| East Coast (PADD 1) Blender Net Input of Gasoline Blending Components (Thousand Barrels) | ||||||||
| Year | Jan | Feb | Mar | Apr | May | Jun | Jul | Aug | Sep | Oct | Nov | Dec |
|---|---|---|---|---|---|---|---|---|---|---|---|---|
| 2005 | 11,440 | 10,866 | 15,415 | 14,952 | 16,160 | 17,608 | 16,412 | 16,897 | 16,532 | 15,778 | 15,602 | 14,912 |
| 2006 | 14,976 | 12,428 | 14,605 | 23,536 | 35,451 | 38,127 | 38,295 | 36,125 | 30,872 | 30,359 | 29,540 | 32,150 |
| 2007 | 29,340 | 27,494 | 29,091 | 30,207 | 34,212 | 35,203 | 34,777 | 33,756 | 32,286 | 33,574 | 30,314 | 30,537 |
| 2008 | 31,029 | 31,187 | 32,591 | 36,597 | 44,425 | 44,739 | 44,882 | 49,657 | 47,255 | 54,627 | 50,715 | 52,849 |
| 2009 | 50,647 | 47,313 | 54,374 | 54,619 | 57,410 | 57,161 | 58,582 | 61,298 | 55,432 | 59,064 | 56,885 | 59,853 |
| 2010 | 56,127 | 52,527 | 61,521 | 63,173 | 71,615 | 68,576 | 73,978 | 73,539 | 68,462 | 73,943 | 70,841 | 73,642 |
| 2011 | 67,295 | 65,253 | 72,214 | 75,025 | 78,000 | 76,522 | 79,298 | 78,568 | 70,702 | 72,776 | 69,414 | 72,628 |
| 2012 | 66,615 | 65,579 | 74,453 | 71,382 | 76,327 | 75,683 | 80,117 | 82,286 | 73,656 | 78,250 | 73,677 | 75,116 |
| 2013 | 70,820 | 66,169 | 75,291 | 78,149 | 82,157 | 79,864 | 81,841 | 82,113 | 74,752 | 77,837 | 74,104 | 75,989 |
| 2014 | 72,039 | 66,991 | 77,419 | 77,532 | 84,016 | 81,992 | 84,272 | 83,749 | 77,421 | 82,130 | 76,366 | 80,139 |
| 2015 | 78,320 | 71,761 | 80,562 | 81,592 | 87,642 | 84,973 | 87,847 | 87,998 | 81,467 | 84,909 | 78,733 | 83,186 |
| 2016 | 79,162 | 78,953 | 86,110 | 84,754 | 90,132 | 89,114 | 90,605 | 91,657 | 83,489 | 87,024 | 83,204 | 86,499 |
| 2017 | 78,860 | 75,393 | 86,389 | 85,173 | 91,108 | 89,092 | 90,433 | 91,271 | 82,700 | 87,690 | 83,514 | 85,574 |
| 2018 | 80,619 | 75,944 | 87,106 | 84,957 | 90,660 | 88,921 | 89,372 | 90,801 | 81,634 | 86,990 | 84,390 | 86,425 |
| 2019 | 83,080 | 76,134 | 88,562 | 86,402 | 91,857 | 88,164 | 91,909 | 93,048 | 83,020 | 87,636 | 84,882 | 84,985 |
| 2020 | 82,549 | 79,859 | 73,649 | 49,527 | 65,410 | 75,292 | 80,384 | 82,087 | 76,696 | 79,815 | 73,450 | 74,813 |
| 2021 | 73,373 | 67,421 | 81,672 | 82,865 | 87,854 | 84,794 | 89,549 | 89,294 | 83,024 | 85,635 | 82,375 | 82,352 |
| 2022 | 75,017 | 75,827 | 85,078 | 82,762 | 89,033 | 86,124 | 86,798 | 89,330 | 83,060 | 85,186 | 82,576 | 84,884 |
| 2023 | 79,328 | 75,380 | 86,807 | 84,663 | 90,066 | 85,600 | 88,928 | 90,329 | 82,057 | 86,332 | 82,778 | 81,998 |
| 2024 | 80,108 | 78,183 | 85,211 | 85,034 | 90,459 | 86,012 | ||||||
| - = No Data Reported; -- = Not Applicable; NA = Not Available; W = Withheld to avoid disclosure of individual company data. |
| Release Date: 8/30/2024 |
| Next Release Date: 9/30/2024 |