|
Download Data (XLS File) |
|
||||||||
|
||||||||
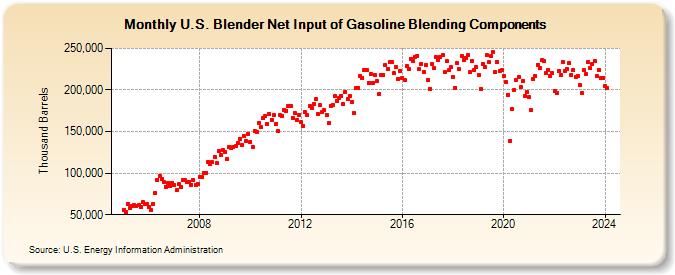
| U.S. Blender Net Input of Gasoline Blending Components (Thousand Barrels) | ||||||||
| Year | Jan | Feb | Mar | Apr | May | Jun | Jul | Aug | Sep | Oct | Nov | Dec |
|---|---|---|---|---|---|---|---|---|---|---|---|---|
| 2005 | 56,154 | 52,991 | 62,617 | 58,020 | 61,001 | 61,099 | 60,272 | 61,102 | 59,025 | 64,887 | 62,390 | 62,491 |
| 2006 | 59,836 | 55,356 | 63,315 | 75,910 | 92,068 | 96,635 | 92,511 | 88,753 | 83,785 | 88,461 | 84,059 | 88,559 |
| 2007 | 85,709 | 79,196 | 86,526 | 83,170 | 91,554 | 91,212 | 89,635 | 89,896 | 86,299 | 91,427 | 86,126 | 86,920 |
| 2008 | 95,455 | 94,865 | 100,119 | 100,653 | 113,870 | 110,668 | 113,012 | 119,681 | 111,807 | 126,580 | 121,557 | 127,709 |
| 2009 | 124,964 | 116,821 | 131,812 | 130,282 | 131,957 | 132,284 | 136,218 | 141,366 | 133,462 | 144,374 | 138,922 | 147,580 |
| 2010 | 137,639 | 131,910 | 150,595 | 149,433 | 160,790 | 155,824 | 166,273 | 168,367 | 159,087 | 170,902 | 164,305 | 169,525 |
| 2011 | 159,128 | 150,942 | 169,542 | 169,094 | 176,308 | 175,226 | 181,284 | 181,216 | 166,807 | 172,028 | 164,056 | 170,026 |
| 2012 | 160,981 | 157,110 | 173,039 | 169,327 | 180,460 | 177,991 | 183,392 | 189,067 | 171,398 | 181,486 | 173,396 | 175,400 |
| 2013 | 169,869 | 160,243 | 181,290 | 182,037 | 192,331 | 186,737 | 190,472 | 193,192 | 182,663 | 198,143 | 189,089 | 192,336 |
| 2014 | 185,233 | 172,306 | 202,097 | 202,652 | 216,442 | 214,702 | 224,251 | 224,436 | 208,777 | 219,477 | 208,622 | 218,122 |
| 2015 | 211,151 | 195,297 | 217,836 | 217,911 | 229,861 | 225,525 | 233,512 | 233,269 | 219,881 | 227,570 | 213,326 | 223,279 |
| 2016 | 214,490 | 211,853 | 228,579 | 224,886 | 237,584 | 234,290 | 239,641 | 241,391 | 225,428 | 231,689 | 221,802 | 229,573 |
| 2017 | 212,356 | 201,527 | 230,695 | 225,903 | 239,462 | 236,050 | 239,108 | 241,906 | 221,091 | 234,328 | 223,486 | 227,255 |
| 2018 | 215,612 | 202,696 | 232,313 | 224,857 | 241,278 | 236,360 | 239,021 | 241,480 | 221,363 | 234,551 | 224,363 | 227,785 |
| 2019 | 218,011 | 201,193 | 231,575 | 227,916 | 241,656 | 233,201 | 241,079 | 245,251 | 221,609 | 234,003 | 222,906 | 223,580 |
| 2020 | 216,314 | 209,827 | 194,322 | 138,503 | 176,684 | 200,209 | 212,556 | 215,452 | 203,270 | 211,120 | 192,288 | 197,096 |
| 2021 | 191,259 | 175,447 | 213,279 | 216,586 | 230,525 | 225,999 | 235,662 | 234,373 | 220,228 | 224,611 | 216,506 | 220,259 |
| 2022 | 199,148 | 196,642 | 223,157 | 218,157 | 233,379 | 223,035 | 225,095 | 232,475 | 218,539 | 223,874 | 215,463 | 217,063 |
| 2023 | 205,858 | 196,874 | 223,468 | 219,567 | 234,123 | 226,085 | 230,853 | 234,859 | 216,893 | 224,461 | 214,057 | 214,803 |
| 2024 | 205,010 | 202,304 | ||||||||||
| - = No Data Reported; -- = Not Applicable; NA = Not Available; W = Withheld to avoid disclosure of individual company data. |
| Release Date: 4/30/2024 |
| Next Release Date: 5/31/2024 |