|
Download Data (XLS File) |
|
||||||||
|
||||||||
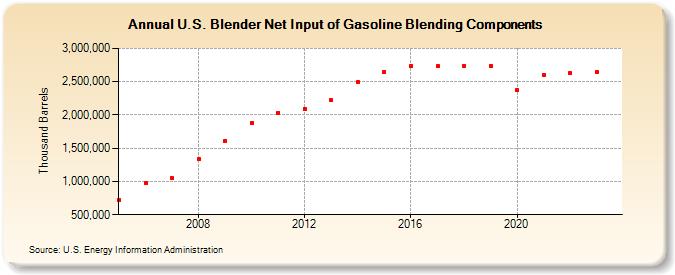
| U.S. Blender Net Input of Gasoline Blending Components (Thousand Barrels) | ||||||||
| Decade | Year-0 | Year-1 | Year-2 | Year-3 | Year-4 | Year-5 | Year-6 | Year-7 | Year-8 | Year-9 |
|---|---|---|---|---|---|---|---|---|---|---|
| 2000's | 722,049 | 969,248 | 1,047,670 | 1,335,976 | 1,610,042 | |||||
| 2010's | 1,884,650 | 2,035,657 | 2,093,047 | 2,218,402 | 2,497,117 | 2,648,418 | 2,741,206 | 2,733,167 | 2,741,679 | 2,741,980 |
| 2020's | 2,367,641 | 2,604,734 | 2,626,027 | 2,641,901 |
| - = No Data Reported; -- = Not Applicable; NA = Not Available; W = Withheld to avoid disclosure of individual company data. |
| Release Date: 3/29/2024 |
| Next Release Date: 8/30/2024 |