|
Download Data (XLS File) |
|
||||||||
|
||||||||
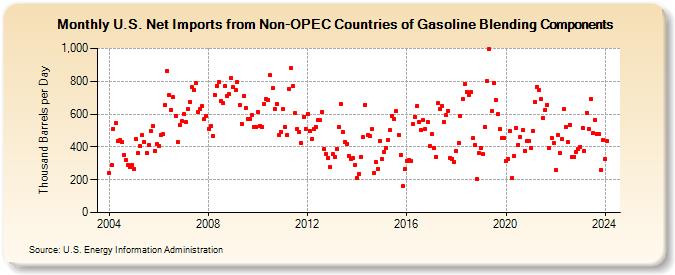
| U.S. Net Imports from Non-OPEC Countries of Gasoline Blending Components (Thousand Barrels per Day) | ||||||||
| Year | Jan | Feb | Mar | Apr | May | Jun | Jul | Aug | Sep | Oct | Nov | Dec |
|---|---|---|---|---|---|---|---|---|---|---|---|---|
| 2004 | 241 | 289 | 512 | 545 | 435 | 439 | 429 | 353 | 323 | 290 | 275 | 289 |
| 2005 | 266 | 446 | 360 | 404 | 470 | 428 | 363 | 410 | 496 | 528 | 378 | 418 |
| 2006 | 407 | 472 | 476 | 656 | 865 | 715 | 626 | 701 | 590 | 429 | 536 | 556 |
| 2007 | 601 | 553 | 629 | 675 | 762 | 748 | 789 | 613 | 630 | 649 | 572 | 590 |
| 2008 | 509 | 525 | 467 | 719 | 770 | 795 | 679 | 665 | 770 | 709 | 722 | 820 |
| 2009 | 762 | 746 | 795 | 654 | 540 | 712 | 639 | 570 | 570 | 594 | 524 | 521 |
| 2010 | 614 | 529 | 521 | 662 | 692 | 686 | 836 | 759 | 632 | 662 | 472 | 491 |
| 2011 | 628 | 523 | 472 | 750 | 879 | 769 | 605 | 509 | 491 | 423 | 585 | 512 |
| 2012 | 602 | 499 | 450 | 508 | 523 | 561 | 564 | 615 | 386 | 358 | 334 | 279 |
| 2013 | 354 | 339 | 388 | 523 | 661 | 489 | 430 | 420 | 346 | 326 | 332 | 290 |
| 2014 | 210 | 237 | 341 | 459 | 657 | 472 | 469 | 509 | 241 | 308 | 267 | 436 |
| 2015 | 326 | 371 | 396 | 445 | 500 | 586 | 569 | 617 | 474 | 353 | 160 | 265 |
| 2016 | 313 | 320 | 316 | 539 | 585 | 649 | 552 | 501 | 561 | 512 | 552 | 404 |
| 2017 | 478 | 395 | 340 | 665 | 629 | 648 | 551 | 594 | 619 | 335 | 328 | 309 |
| 2018 | 373 | 426 | 591 | 689 | 782 | 736 | 716 | 735 | 452 | 410 | 206 | 360 |
| 2019 | 395 | 355 | 521 | 800 | 994 | 618 | 789 | 687 | 599 | 510 | 454 | 454 |
| 2020 | 316 | 325 | 498 | 212 | 346 | 517 | 414 | 460 | 502 | 378 | 433 | 435 |
| 2021 | 396 | 499 | 675 | 765 | 748 | 691 | 578 | 627 | 658 | 395 | 456 | 424 |
| 2022 | 262 | 472 | 365 | 447 | 630 | 523 | 427 | 535 | 338 | 341 | 369 | 385 |
| 2023 | 402 | 516 | 377 | 608 | 512 | 693 | 482 | 566 | 477 | 480 | 261 | 443 |
| 2024 | 325 | |||||||||||
| - = No Data Reported; -- = Not Applicable; NA = Not Available; W = Withheld to avoid disclosure of individual company data. |
| Release Date: 3/29/2024 |
| Next Release Date: 4/30/2024 |