|
Download Data (XLS File) |
|
||||||||
|
||||||||
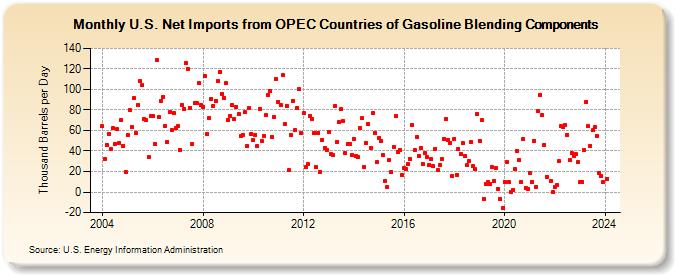
| U.S. Net Imports from OPEC Countries of Gasoline Blending Components (Thousand Barrels per Day) | ||||||||
| Year | Jan | Feb | Mar | Apr | May | Jun | Jul | Aug | Sep | Oct | Nov | Dec |
|---|---|---|---|---|---|---|---|---|---|---|---|---|
| 2004 | 64 | 32 | 46 | 57 | 42 | 62 | 47 | 61 | 48 | 70 | 45 | 20 |
| 2005 | 56 | 80 | 63 | 92 | 58 | 85 | 108 | 104 | 71 | 70 | 34 | 74 |
| 2006 | 74 | 47 | 129 | 73 | 89 | 93 | 64 | 49 | 78 | 60 | 77 | 62 |
| 2007 | 64 | 41 | 85 | 81 | 126 | 120 | 82 | 47 | 87 | 87 | 106 | 85 |
| 2008 | 83 | 113 | 57 | 72 | 91 | 84 | 89 | 108 | 117 | 96 | 92 | 106 |
| 2009 | 70 | 74 | 85 | 71 | 83 | 76 | 55 | 56 | 78 | 45 | 82 | 57 |
| 2010 | 51 | 56 | 45 | 81 | 50 | 55 | 75 | 95 | 98 | 54 | 73 | 110 |
| 2011 | 88 | 85 | 114 | 66 | 84 | 21 | 56 | 89 | 60 | 82 | 100 | 58 |
| 2012 | 77 | 24 | 27 | 74 | 71 | 58 | 24 | 58 | 20 | 51 | 43 | 41 |
| 2013 | 59 | 37 | 36 | 84 | 49 | 68 | 81 | 69 | 38 | 47 | 47 | 36 |
| 2014 | 52 | 35 | 34 | 62 | 72 | 24 | 48 | 66 | 43 | 77 | 58 | 29 |
| 2015 | 53 | 50 | 36 | 11 | 5 | 31 | 20 | 44 | 74 | 39 | 41 | 17 |
| 2016 | 23 | 22 | 27 | 32 | 65 | 41 | 54 | 35 | 43 | 27 | 38 | 34 |
| 2017 | 26 | 32 | 25 | 42 | 21 | 26 | 32 | 52 | 71 | 51 | 48 | 16 |
| 2018 | 52 | 17 | 42 | 37 | 48 | 35 | 26 | 30 | 49 | 25 | 22 | 76 |
| 2019 | 50 | 70 | -7 | 8 | 10 | 8 | 24 | 11 | 23 | 3 | -7 | -16 |
| 2020 | 10 | 29 | 10 | 0 | 2 | 22 | 40 | 31 | 10 | 52 | 4 | 3 |
| 2021 | 19 | 10 | 50 | 5 | 79 | 95 | 75 | 46 | 15 | 11 | 0 | |
| 2022 | 5 | 7 | 30 | 64 | 63 | 65 | 56 | 31 | 38 | 35 | 37 | 29 |
| 2023 | 10 | 10 | 41 | 88 | 64 | 45 | 60 | 63 | 55 | 19 | 16 | 10 |
| - = No Data Reported; -- = Not Applicable; NA = Not Available; W = Withheld to avoid disclosure of individual company data. |
| Release Date: 3/29/2024 |
| Next Release Date: 4/30/2024 |