|
Download Data (XLS File) |
|
||||||||
|
||||||||
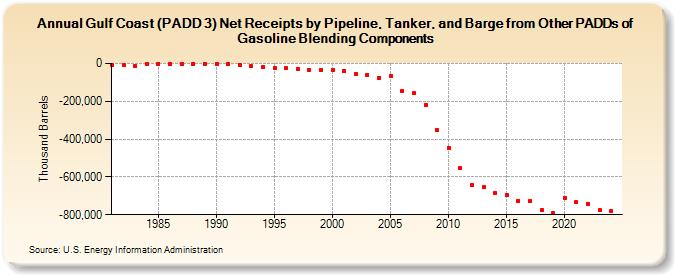
| Gulf Coast (PADD 3) Net Receipts by Pipeline, Tanker, and Barge from Other PADDs of Gasoline Blending Components (Thousand Barrels) | ||||||||
| Decade | Year-0 | Year-1 | Year-2 | Year-3 | Year-4 | Year-5 | Year-6 | Year-7 | Year-8 | Year-9 |
|---|---|---|---|---|---|---|---|---|---|---|
| 1980's | -9,216 | -8,968 | -12,935 | -1,488 | -663 | -2,269 | -1,927 | -757 | -2,612 | |
| 1990's | -3,183 | -4,364 | -6,389 | -12,139 | -19,704 | -23,813 | -26,096 | -28,107 | -33,473 | -34,811 |
| 2000's | -32,675 | -39,875 | -55,000 | -62,062 | -76,301 | -65,785 | -145,600 | -157,540 | -217,986 | -353,840 |
| 2010's | -446,109 | -554,045 | -642,707 | -653,761 | -683,559 | -695,236 | -724,873 | -728,597 | -775,181 | -792,742 |
| 2020's | -709,502 | -733,806 | -744,318 | -777,915 |
| - = No Data Reported; -- = Not Applicable; NA = Not Available; W = Withheld to avoid disclosure of individual company data. |
| Release Date: 3/29/2024 |
| Next Release Date: 8/30/2024 |