|
Download Data (XLS File) |
|
||||||||
|
||||||||
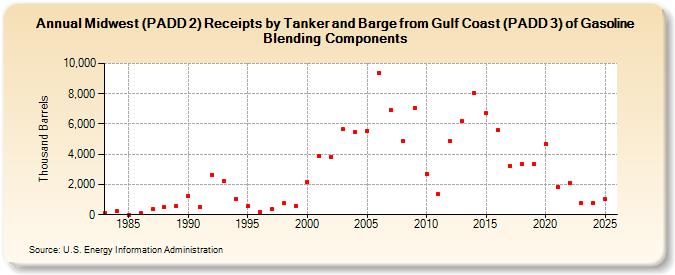
| Midwest (PADD 2) Receipts by Tanker and Barge from Gulf Coast (PADD 3) of Gasoline Blending Components (Thousand Barrels) | ||||||||
| Decade | Year-0 | Year-1 | Year-2 | Year-3 | Year-4 | Year-5 | Year-6 | Year-7 | Year-8 | Year-9 |
|---|---|---|---|---|---|---|---|---|---|---|
| 1980's | 84 | 218 | 0 | 84 | 372 | 488 | 558 | |||
| 1990's | 1,227 | 505 | 2,644 | 2,252 | 1,027 | 559 | 170 | 350 | 759 | 586 |
| 2000's | 2,186 | 3,876 | 3,822 | 5,636 | 5,459 | 5,557 | 9,401 | 6,950 | 4,849 | 7,079 |
| 2010's | 2,717 | 1,349 | 4,843 | 6,188 | 8,078 | 6,708 | 5,626 | 3,252 | 3,341 | 3,335 |
| 2020's | 4,659 | 1,828 | 2,128 | 805 |
| - = No Data Reported; -- = Not Applicable; NA = Not Available; W = Withheld to avoid disclosure of individual company data. |
| Release Date: 8/30/2024 |
| Next Release Date: 8/29/2025 |