|
Download Data (XLS File) |
|
||||||||
|
||||||||
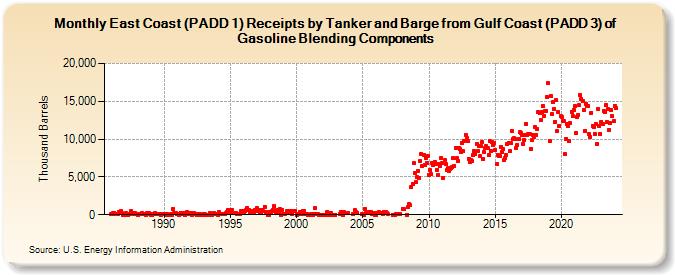
| East Coast (PADD 1) Receipts by Tanker and Barge from Gulf Coast (PADD 3) of Gasoline Blending Components (Thousand Barrels) | ||||||||
| Year | Jan | Feb | Mar | Apr | May | Jun | Jul | Aug | Sep | Oct | Nov | Dec |
|---|---|---|---|---|---|---|---|---|---|---|---|---|
| 1986 | 92 | 66 | 179 | 280 | 124 | 148 | 145 | 376 | 277 | 440 | 252 | 23 |
| 1987 | 0 | 23 | 188 | 0 | 74 | 146 | 474 | 203 | 194 | 146 | 176 | 39 |
| 1988 | 19 | 105 | 109 | 38 | 163 | 63 | 114 | 53 | 0 | 181 | 166 | 136 |
| 1989 | 0 | 0 | 68 | 33 | 173 | 103 | 109 | 59 | 67 | 0 | 114 | 125 |
| 1990 | 110 | 108 | 0 | 110 | 8 | 0 | 97 | 0 | 771 | 185 | 199 | 171 |
| 1991 | 99 | 112 | 0 | 265 | 43 | 230 | 225 | 0 | 99 | 335 | 210 | 134 |
| 1992 | 163 | 0 | 53 | 185 | 78 | 61 | 0 | 0 | 154 | 0 | 0 | 50 |
| 1993 | 0 | 34 | 0 | 0 | 0 | 0 | 246 | 0 | 49 | 181 | 36 | 55 |
| 1994 | 39 | 19 | 294 | 43 | 42 | 43 | 38 | 133 | 170 | 383 | 686 | 583 |
| 1995 | 675 | 313 | 608 | 238 | 179 | 198 | 128 | 90 | 52 | 108 | 489 | 431 |
| 1996 | 390 | 473 | 571 | 869 | 632 | 666 | 375 | 487 | 222 | 413 | 633 | 682 |
| 1997 | 943 | 467 | 587 | 222 | 354 | 561 | 428 | 1,060 | 420 | 337 | 18 | 21 |
| 1998 | 381 | 332 | 433 | 684 | 1,176 | 191 | 644 | 627 | 267 | 763 | 20 | 688 |
| 1999 | 42 | 153 | 155 | 434 | 358 | 433 | 430 | 384 | 122 | 444 | 471 | 486 |
| 2000 | 25 | 111 | 95 | 380 | 217 | 156 | 465 | 484 | 91 | 35 | 20 | 16 |
| 2001 | 0 | 75 | 0 | 0 | 140 | 877 | 147 | 43 | 0 | 0 | 0 | 0 |
| 2002 | 0 | 0 | 0 | 0 | 404 | 0 | 238 | 161 | 0 | 0 | 0 | 0 |
| 2003 | 57 | 372 | 107 | 20 | 308 | 183 | ||||||
| 2004 | 60 | 564 | 299 | 283 | 60 | |||||||
| 2005 | 134 | 6 | 760 | 290 | 282 | 209 | 387 | 331 | 151 | 76 | 182 | 0 |
| 2006 | 0 | 282 | 211 | 301 | 230 | 61 | 422 | 245 | 318 | 174 | 30 | |
| 2007 | 0 | 0 | 69 | 80 | 100 | |||||||
| 2008 | 813 | 756 | 0 | 1,004 | 1,433 | 1,235 | 3,682 | 4,071 | 6,803 | 5,527 | ||
| 2009 | 4,292 | 4,937 | 5,810 | 4,920 | 7,156 | 8,088 | 6,402 | 7,941 | 6,625 | 7,493 | 6,881 | 7,790 |
| 2010 | 5,239 | 5,866 | 5,323 | 6,859 | 6,605 | 7,006 | 6,709 | 5,972 | 5,228 | 6,646 | 6,466 | 7,515 |
| 2011 | 6,828 | 4,910 | 7,218 | 6,644 | 5,907 | 6,139 | 5,796 | 6,086 | 6,190 | 6,304 | 7,450 | 6,434 |
| 2012 | 8,834 | 7,481 | 7,166 | 8,827 | 8,681 | 8,274 | 9,520 | 8,424 | 9,813 | 10,602 | 10,085 | 9,730 |
| 2013 | 7,427 | 7,010 | 7,270 | 7,039 | 7,896 | 8,396 | 7,995 | 9,388 | 8,424 | 9,150 | 7,745 | 9,072 |
| 2014 | 9,572 | 7,365 | 8,253 | 8,838 | 9,034 | 8,822 | 7,875 | 9,697 | 8,371 | 9,574 | 9,228 | 9,471 |
| 2015 | 8,559 | 6,666 | 7,949 | 7,795 | 7,769 | 8,989 | 8,301 | 8,644 | 7,279 | 7,518 | 7,913 | 9,395 |
| 2016 | 9,526 | 8,387 | 9,440 | 11,079 | 10,015 | 10,100 | 9,967 | 8,819 | 9,252 | 10,033 | 10,897 | 10,789 |
| 2017 | 10,519 | 9,402 | 9,871 | 10,589 | 12,018 | 10,517 | 10,631 | 10,625 | 8,749 | 9,878 | 10,509 | 10,221 |
| 2018 | 11,596 | 10,520 | 11,323 | 13,526 | 13,503 | 12,472 | 13,566 | 14,350 | 13,088 | 13,728 | 13,755 | 15,603 |
| 2019 | 17,368 | 9,697 | 15,751 | 13,344 | 14,863 | 13,979 | 12,300 | 15,160 | 11,056 | 13,620 | 11,749 | 13,041 |
| 2020 | 12,860 | 12,410 | 12,375 | 7,975 | 10,062 | 11,962 | 11,770 | 9,729 | 12,091 | 13,623 | 13,002 | 13,892 |
| 2021 | 14,318 | 10,778 | 12,874 | 13,252 | 14,450 | 15,812 | 15,313 | 14,982 | 13,883 | 11,131 | 14,642 | 14,370 |
| 2022 | 14,383 | 10,632 | 10,294 | 13,493 | 11,778 | 11,544 | 10,722 | 12,003 | 9,341 | 13,982 | 11,748 | 10,664 |
| 2023 | 12,317 | 12,038 | 13,739 | 13,537 | 14,525 | 12,296 | 13,965 | 11,244 | 12,177 | 13,871 | 13,004 | 12,389 |
| 2024 | 14,390 | 14,055 | 15,232 | 15,264 | 15,420 | 14,365 | ||||||
| - = No Data Reported; -- = Not Applicable; NA = Not Available; W = Withheld to avoid disclosure of individual company data. |
| Release Date: 8/30/2024 |
| Next Release Date: 9/30/2024 |