|
Download Data (XLS File) |
|
||||||||
|
||||||||
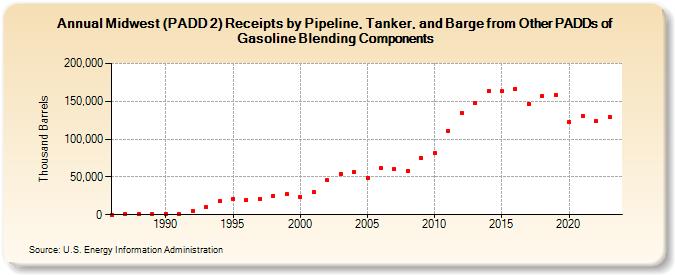
| Midwest (PADD 2) Receipts by Pipeline, Tanker, and Barge from Other PADDs of Gasoline Blending Components (Thousand Barrels) | ||||||||
| Decade | Year-0 | Year-1 | Year-2 | Year-3 | Year-4 | Year-5 | Year-6 | Year-7 | Year-8 | Year-9 |
|---|---|---|---|---|---|---|---|---|---|---|
| 1980's | 84 | 674 | 789 | 900 | ||||||
| 1990's | 1,411 | 930 | 5,114 | 9,885 | 17,617 | 21,185 | 20,084 | 21,239 | 25,066 | 26,737 |
| 2000's | 23,602 | 30,254 | 45,273 | 53,843 | 56,809 | 49,194 | 61,505 | 60,444 | 57,790 | 75,182 |
| 2010's | 81,379 | 111,284 | 134,899 | 147,599 | 163,275 | 163,215 | 166,835 | 147,071 | 157,073 | 158,321 |
| 2020's | 122,709 | 130,620 | 123,915 | 128,970 |
| - = No Data Reported; -- = Not Applicable; NA = Not Available; W = Withheld to avoid disclosure of individual company data. |
| Release Date: 8/30/2024 |
| Next Release Date: 8/29/2025 |
Referring Pages: