|
Download Data (XLS File) |
|
||||||||
|
||||||||
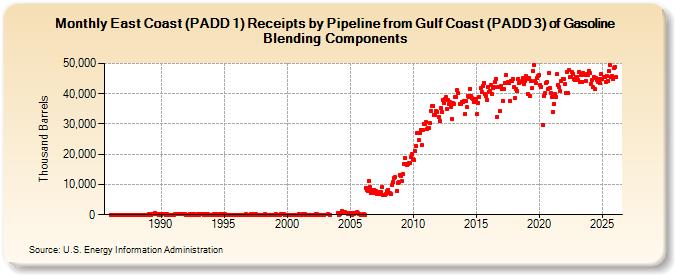
| East Coast (PADD 1) Receipts by Pipeline from Gulf Coast (PADD 3) of Gasoline Blending Components (Thousand Barrels) | ||||||||
| Year | Jan | Feb | Mar | Apr | May | Jun | Jul | Aug | Sep | Oct | Nov | Dec |
|---|---|---|---|---|---|---|---|---|---|---|---|---|
| 1986 | 0 | 0 | 0 | 0 | 0 | 0 | 0 | 0 | 0 | 0 | 0 | 0 |
| 1987 | 0 | 0 | 0 | 0 | 0 | 0 | 0 | 0 | 0 | 0 | 0 | 0 |
| 1988 | 0 | 0 | 0 | 0 | 0 | 0 | 0 | 0 | 0 | 0 | 0 | 0 |
| 1989 | 86 | 78 | 0 | 251 | 166 | 266 | 511 | 255 | 176 | 77 | 0 | 84 |
| 1990 | 25 | 82 | 73 | 255 | 232 | 0 | 74 | 0 | 0 | 0 | 0 | 0 |
| 1991 | 0 | 169 | 348 | 279 | 178 | 163 | 84 | 164 | 358 | 177 | 378 | 128 |
| 1992 | 0 | 0 | 0 | 73 | 171 | 0 | 86 | 77 | 0 | 0 | 0 | 83 |
| 1993 | 0 | 86 | 259 | 168 | 153 | 0 | 170 | 55 | 370 | 146 | 0 | 0 |
| 1994 | 0 | 0 | 72 | 0 | 143 | 0 | 0 | 0 | 227 | 0 | 0 | 97 |
| 1995 | 187 | 84 | 0 | 0 | 0 | 0 | 0 | 0 | 0 | 0 | 0 | 0 |
| 1996 | 0 | 0 | 0 | 0 | 0 | 0 | 0 | 0 | 0 | 83 | 0 | 0 |
| 1997 | 0 | 82 | 0 | 101 | 0 | 0 | 148 | 0 | 0 | 0 | 0 | 0 |
| 1998 | 0 | 0 | 0 | 142 | 0 | 0 | 0 | 0 | 0 | 0 | 0 | 0 |
| 1999 | 0 | 138 | 0 | 0 | 0 | 0 | 75 | 82 | 216 | 224 | 65 | 0 |
| 2000 | 0 | 65 | 0 | 0 | 0 | 29 | 0 | 0 | 10 | 0 | 0 | 261 |
| 2001 | 0 | 2 | 0 | 146 | 247 | 78 | 0 | 0 | 0 | 0 | 1 | 0 |
| 2002 | 0 | 0 | 0 | 182 | 113 | 0 | 0 | 2 | 0 | 0 | 0 | 0 |
| 2003 | 100 | 2 | ||||||||||
| 2004 | 444 | 17 | 249 | 553 | 1,072 | 707 | 964 | 835 | 545 | 493 | 327 | 545 |
| 2005 | 274 | 474 | 11 | 581 | 261 | 456 | 749 | 432 | 222 | 7 | ||
| 2006 | 216 | 132 | 62 | 8,965 | 8,022 | 7,865 | 11,062 | 9,176 | 7,051 | 8,199 | 7,118 | 8,264 |
| 2007 | 7,828 | 6,886 | 7,424 | 7,650 | 6,814 | 7,409 | 9,022 | 6,500 | 6,394 | 6,677 | 6,827 | 7,859 |
| 2008 | 8,330 | 7,224 | 7,032 | 6,744 | 9,845 | 10,778 | 12,254 | 12,314 | 7,929 | 10,485 | 10,904 | 12,993 |
| 2009 | 12,833 | 11,143 | 13,406 | 16,769 | 18,844 | 16,651 | 16,423 | 16,796 | 17,215 | 17,093 | 19,062 | 19,913 |
| 2010 | 18,372 | 17,972 | 20,940 | 22,654 | 27,143 | 24,730 | 26,935 | 28,117 | 22,943 | 28,111 | 30,113 | 30,099 |
| 2011 | 30,783 | 28,238 | 28,712 | 28,696 | 30,207 | 34,243 | 35,793 | 35,969 | 33,027 | 32,811 | 34,373 | 34,021 |
| 2012 | 32,372 | 30,842 | 35,163 | 34,090 | 37,968 | 36,998 | 38,209 | 38,787 | 34,916 | 37,992 | 36,622 | 37,214 |
| 2013 | 35,663 | 31,684 | 36,816 | 36,719 | 38,970 | 38,926 | 41,137 | 40,153 | 36,603 | 36,670 | 37,372 | 37,349 |
| 2014 | 37,663 | 33,215 | 37,456 | 35,622 | 39,270 | 38,767 | 41,710 | 39,322 | 38,526 | 38,154 | 37,249 | 37,286 |
| 2015 | 38,355 | 33,287 | 37,089 | 39,073 | 41,848 | 40,609 | 42,658 | 43,617 | 39,807 | 39,319 | 38,048 | 42,318 |
| 2016 | 40,727 | 41,035 | 42,735 | 39,853 | 41,748 | 42,086 | 43,959 | 44,962 | 32,306 | 42,197 | 34,353 | 42,412 |
| 2017 | 41,555 | 37,689 | 41,504 | 43,554 | 46,151 | 43,500 | 43,750 | 43,640 | 37,683 | 44,333 | 44,363 | 44,956 |
| 2018 | 42,263 | 38,538 | 41,585 | 40,922 | 44,961 | 43,642 | 44,033 | 44,092 | 45,127 | 43,121 | 44,332 | 45,972 |
| 2019 | 44,869 | 39,972 | 45,179 | 39,167 | 44,149 | 41,777 | 47,561 | 49,454 | 44,230 | 43,485 | 45,240 | 45,871 |
| 2020 | 46,208 | 42,898 | 42,367 | 29,770 | 39,265 | 40,179 | 43,643 | 43,958 | 41,548 | 46,781 | 42,008 | 40,269 |
| 2021 | 38,768 | 34,109 | 36,620 | 39,947 | 39,070 | 46,482 | 42,885 | 42,221 | 41,048 | 44,070 | 44,799 | 45,031 |
| 2022 | 43,200 | 40,107 | 47,175 | 40,243 | 47,814 | 45,441 | 45,391 | 47,165 | 46,664 | 44,813 | 44,483 | 45,408 |
| 2023 | 45,631 | 44,515 | 47,292 | 44,019 | 46,035 | 43,988 | 46,785 | 46,306 | 44,333 | 46,567 | 46,175 | 47,613 |
| 2024 | 46,771 | 43,365 | 44,671 | 42,084 | 45,468 | 41,492 | ||||||
| - = No Data Reported; -- = Not Applicable; NA = Not Available; W = Withheld to avoid disclosure of individual company data. |
| Release Date: 8/30/2024 |
| Next Release Date: 9/30/2024 |