|
Download Data (XLS File) |
|
||||||||
|
||||||||
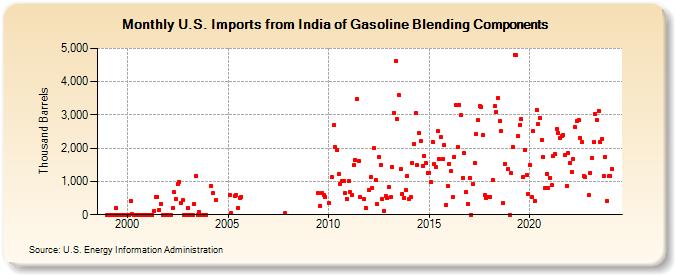
| U.S. Imports from India of Gasoline Blending Components (Thousand Barrels) | ||||||||
| Year | Jan | Feb | Mar | Apr | May | Jun | Jul | Aug | Sep | Oct | Nov | Dec |
|---|---|---|---|---|---|---|---|---|---|---|---|---|
| 1999 | 0 | 0 | 0 | 0 | 0 | 196 | 0 | 0 | 0 | 0 | 0 | 0 |
| 2000 | 0 | 0 | 405 | 17 | 0 | 0 | 0 | 0 | 0 | 0 | 0 | 0 |
| 2001 | 0 | 0 | 0 | 0 | 115 | 535 | 539 | 150 | 330 | 0 | 0 | 0 |
| 2002 | 0 | 0 | 0 | 200 | 672 | 473 | 912 | 995 | 346 | 433 | 0 | 0 |
| 2003 | 208 | 0 | 0 | 0 | 327 | 1,161 | 0 | 75 | 0 | 0 | 0 | 0 |
| 2004 | 871 | 644 | 442 | |||||||||
| 2005 | 607 | 43 | 567 | 600 | 208 | 513 | 546 | |||||
| 2007 | 38 | |||||||||||
| 2009 | 642 | 270 | 646 | 603 | 538 | |||||||
| 2010 | 355 | 1,119 | 2,683 | 2,025 | 1,953 | 1,212 | 936 | 1,019 | 1,023 | 648 | 470 | |
| 2011 | 1,000 | 671 | 601 | 1,481 | 1,649 | 3,492 | 1,618 | 529 | 473 | 203 | ||
| 2012 | 747 | 1,122 | 818 | 1,993 | 1,030 | 327 | 1,738 | 1,506 | 464 | 98 | 575 | 507 |
| 2013 | 835 | 527 | 1,423 | 3,066 | 4,627 | 2,875 | 3,589 | 1,380 | 633 | 516 | 750 | 1,158 |
| 2014 | 461 | 520 | 1,551 | 2,139 | 3,057 | 1,486 | 2,455 | 2,206 | 1,466 | 1,775 | 1,544 | 1,263 |
| 2015 | 1,269 | 970 | 2,200 | 1,523 | 1,435 | 2,507 | 1,675 | 2,326 | 1,670 | 2,090 | 298 | 870 |
| 2016 | 1,525 | 1,303 | 523 | 1,742 | 3,306 | 2,030 | 3,310 | 2,986 | 1,111 | 1,845 | 697 | 319 |
| 2017 | 1,117 | 1 | 914 | 1,566 | 2,412 | 2,843 | 3,268 | 3,250 | 2,382 | 591 | 516 | 518 |
| 2018 | 527 | 1,047 | 3,258 | 3,097 | 3,511 | 2,813 | 2,521 | 353 | 1,528 | 1,367 | ||
| 2019 | 5 | 1,244 | 2,035 | 4,814 | 4,787 | 2,360 | 2,690 | 2,863 | 1,144 | 1,941 | 1,194 | 636 |
| 2020 | 1,508 | 525 | 2,504 | 419 | 3,159 | 2,717 | 2,917 | 2,256 | 1,740 | 790 | 1,234 | 813 |
| 2021 | 1,113 | 882 | 1,765 | 1,827 | 2,571 | 2,454 | 2,295 | 2,363 | 2,393 | 1,802 | 877 | 1,854 |
| 2022 | 1,564 | 1,281 | 1,684 | 2,642 | 2,817 | 2,833 | 2,292 | 2,178 | 1,173 | 1,133 | 587 | |
| 2023 | 1,265 | 1,719 | 2,174 | 3,032 | 2,856 | 3,126 | 2,171 | 2,272 | 1,161 | 1,746 | 427 | 1,150 |
| 2024 | 1,178 | |||||||||||
| - = No Data Reported; -- = Not Applicable; NA = Not Available; W = Withheld to avoid disclosure of individual company data. |
| Release Date: 3/29/2024 |
| Next Release Date: 4/30/2024 |