|
Download Data (XLS File) |
|
||||||||
|
||||||||
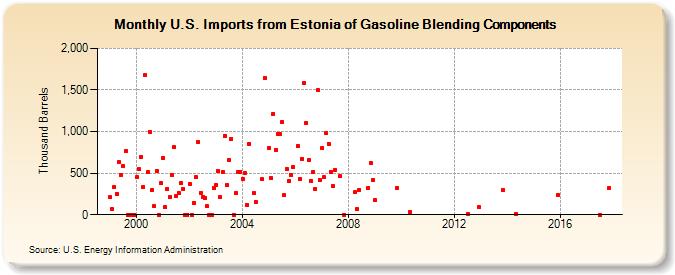
| U.S. Imports from Estonia of Gasoline Blending Components (Thousand Barrels) | ||||||||
| Year | Jan | Feb | Mar | Apr | May | Jun | Jul | Aug | Sep | Oct | Nov | Dec |
|---|---|---|---|---|---|---|---|---|---|---|---|---|
| 1999 | 209 | 64 | 333 | 253 | 628 | 476 | 586 | 765 | 0 | 0 | 0 | 0 |
| 2000 | 448 | 546 | 697 | 335 | 1,678 | 511 | 998 | 299 | 100 | 526 | 0 | 377 |
| 2001 | 680 | 88 | 311 | 207 | 478 | 812 | 226 | 262 | 378 | 311 | 0 | 0 |
| 2002 | 370 | 0 | 145 | 450 | 877 | 265 | 217 | 198 | 99 | 0 | 0 | 327 |
| 2003 | 361 | 521 | 209 | 512 | 952 | 360 | 659 | 914 | 0 | 264 | 513 | 518 |
| 2004 | 431 | 506 | 120 | 855 | 264 | 156 | 425 | 1,648 | ||||
| 2005 | 801 | 439 | 1,216 | 784 | 971 | 965 | 1,119 | 232 | 555 | 404 | 480 | 569 |
| 2006 | 830 | 432 | 670 | 1,581 | 1,105 | 652 | 411 | 517 | 311 | 1,494 | 418 | |
| 2007 | 805 | 449 | 977 | 854 | 516 | 340 | 538 | 460 | 1 | |||
| 2008 | 269 | 64 | 301 | 322 | 626 | 420 | ||||||
| 2009 | 175 | 327 | ||||||||||
| 2010 | 35 | |||||||||||
| 2012 | 12 | 90 | ||||||||||
| 2013 | 300 | |||||||||||
| 2014 | 11 | |||||||||||
| 2015 | 238 | |||||||||||
| 2017 | 1 | 318 | ||||||||||
| - = No Data Reported; -- = Not Applicable; NA = Not Available; W = Withheld to avoid disclosure of individual company data. |
| Release Date: 3/29/2024 |
| Next Release Date: 4/30/2024 |