|
Download Data (XLS File) |
|
||||||||
|
||||||||
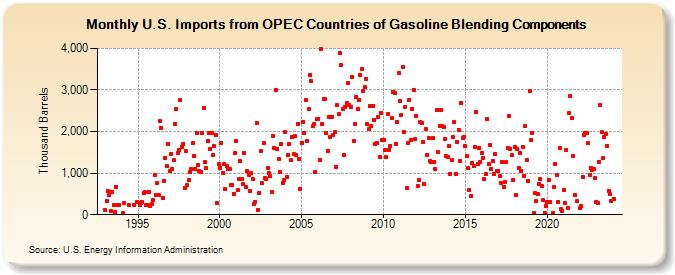
| U.S. Imports from OPEC Countries of Gasoline Blending Components (Thousand Barrels) | ||||||||
| Year | Jan | Feb | Mar | Apr | May | Jun | Jul | Aug | Sep | Oct | Nov | Dec |
|---|---|---|---|---|---|---|---|---|---|---|---|---|
| 1993 | 110 | 319 | 561 | 479 | 99 | 541 | 239 | 70 | 673 | 230 | 240 | |
| 1994 | 46 | 288 | 240 | 239 | 308 | |||||||
| 1995 | 239 | 284 | 303 | 521 | 544 | 229 | 239 | 547 | 217 | 251 | 345 | |
| 1996 | 957 | 478 | 757 | 471 | 2,262 | 2,087 | 396 | 819 | 1,375 | 1,176 | 1,707 | 1,050 |
| 1997 | 1,451 | 1,101 | 1,304 | 2,191 | 2,549 | 1,492 | 1,559 | 2,769 | 1,635 | 1,703 | 640 | 1,529 |
| 1998 | 703 | 842 | 1,023 | 1,097 | 1,716 | 1,421 | 1,095 | 1,972 | 1,205 | 1,061 | 1,025 | 1,966 |
| 1999 | 2,574 | 1,266 | 1,130 | 1,770 | 1,975 | 1,584 | 1,971 | 1,433 | 1,649 | 1,925 | 280 | 1,209 |
| 2000 | 1,130 | 1,720 | 1,011 | 1,220 | 621 | 1,165 | 1,093 | 1,105 | 721 | 711 | 508 | 1,487 |
| 2001 | 1,767 | 592 | 868 | 1,287 | 864 | 741 | 1,493 | 678 | 1,052 | 966 | 573 | 995 |
| 2002 | 862 | 263 | 307 | 2,212 | 120 | 522 | 1,526 | 752 | 1,730 | 873 | 866 | 1,127 |
| 2003 | 995 | 921 | 547 | 1,887 | 1,609 | 3,001 | 1,582 | 1,334 | 1,035 | 1,705 | 773 | 833 |
| 2004 | 1,992 | 919 | 1,441 | 1,695 | 1,317 | 1,859 | 1,455 | 1,884 | 1,440 | 2,174 | 1,341 | 630 |
| 2005 | 1,728 | 2,238 | 1,958 | 2,770 | 1,784 | 2,544 | 3,359 | 3,210 | 2,122 | 2,185 | 1,027 | 2,296 |
| 2006 | 2,306 | 1,313 | 3,987 | 2,182 | 2,774 | 2,786 | 1,970 | 1,533 | 2,345 | 1,861 | 2,359 | 1,916 |
| 2007 | 1,997 | 1,154 | 2,636 | 2,416 | 3,895 | 3,600 | 2,536 | 1,445 | 2,602 | 2,688 | 3,177 | 2,634 |
| 2008 | 2,602 | 3,317 | 1,771 | 2,172 | 2,826 | 2,532 | 2,769 | 3,357 | 3,502 | 2,980 | 3,068 | 3,273 |
| 2009 | 2,175 | 2,068 | 2,626 | 2,131 | 2,616 | 2,288 | 1,702 | 1,734 | 2,344 | 1,382 | 2,450 | 1,787 |
| 2010 | 1,790 | 1,561 | 1,389 | 2,430 | 1,557 | 1,657 | 2,317 | 2,960 | 2,931 | 1,710 | 2,226 | 3,412 |
| 2011 | 2,728 | 2,401 | 3,545 | 1,989 | 2,600 | 636 | 1,723 | 2,768 | 1,793 | 2,554 | 3,001 | 1,822 |
| 2012 | 2,386 | 699 | 842 | 2,218 | 2,200 | 1,749 | 735 | 2,067 | 1,447 | 1,844 | 1,302 | 1,272 |
| 2013 | 1,841 | 1,262 | 1,102 | 2,515 | 1,514 | 2,145 | 2,518 | 2,124 | 2,112 | 1,830 | 1,406 | 1,378 |
| 2014 | 1,652 | 981 | 1,309 | 1,858 | 2,221 | 975 | 1,758 | 2,048 | 1,297 | 2,691 | 1,844 | 1,876 |
| 2015 | 1,656 | 1,402 | 1,130 | 606 | 455 | 1,245 | 1,165 | 1,617 | 2,471 | 1,217 | 1,599 | 1,278 |
| 2016 | 1,487 | 1,364 | 852 | 974 | 2,306 | 1,218 | 1,683 | 1,092 | 1,292 | 986 | 1,450 | 1,062 |
| 2017 | 1,053 | 928 | 773 | 1,273 | 656 | 782 | 1,258 | 1,600 | 2,368 | 1,592 | 1,429 | 834 |
| 2018 | 1,624 | 486 | 1,579 | 1,116 | 1,491 | 1,056 | 1,617 | 941 | 2,141 | 1,309 | 813 | 2,966 |
| 2019 | 1,807 | 1,972 | 42 | 515 | 319 | 492 | 730 | 854 | 697 | 351 | 52 | 205 |
| 2020 | 308 | 837 | 316 | 52 | 660 | 1,230 | 956 | 309 | 1,597 | 130 | 100 | |
| 2021 | 601 | 282 | 1,552 | 164 | 2,456 | 2,852 | 2,321 | 1,415 | 464 | 325 | ||
| 2022 | 150 | 200 | 919 | 1,910 | 1,956 | 1,954 | 1,728 | 958 | 1,135 | 1,083 | 1,106 | 886 |
| 2023 | 316 | 275 | 1,273 | 2,639 | 1,981 | 1,354 | 1,874 | 1,952 | 1,660 | 576 | 489 | 324 |
| 2024 | 375 | 496 | 345 | 1,704 | 47 | |||||||
| - = No Data Reported; -- = Not Applicable; NA = Not Available; W = Withheld to avoid disclosure of individual company data. |
| Release Date: 8/30/2024 |
| Next Release Date: 9/30/2024 |