|
Download Data (XLS File) |
|
||||||||
|
||||||||
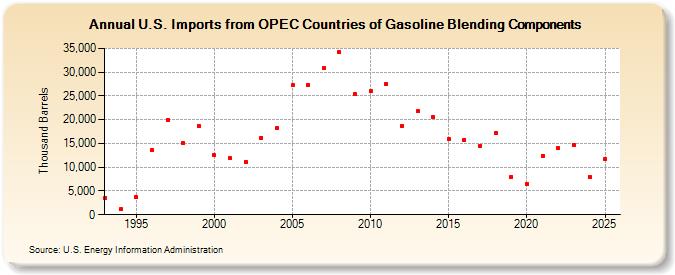
| U.S. Imports from OPEC Countries of Gasoline Blending Components (Thousand Barrels) | ||||||||
| Decade | Year-0 | Year-1 | Year-2 | Year-3 | Year-4 | Year-5 | Year-6 | Year-7 | Year-8 | Year-9 |
|---|---|---|---|---|---|---|---|---|---|---|
| 1990's | 3,561 | 1,121 | 3,719 | 13,535 | 19,923 | 15,126 | 18,766 | |||
| 2000's | 12,492 | 11,876 | 11,160 | 16,222 | 18,147 | 27,221 | 27,332 | 30,780 | 34,169 | 25,303 |
| 2010's | 25,940 | 27,560 | 18,761 | 21,747 | 20,510 | 15,841 | 15,766 | 14,546 | 17,139 | 8,036 |
| 2020's | 6,495 | 12,432 | 13,985 | 14,713 |
| - = No Data Reported; -- = Not Applicable; NA = Not Available; W = Withheld to avoid disclosure of individual company data. |
| Release Date: 8/30/2024 |
| Next Release Date: 8/29/2025 |