|
Download Data (XLS File) |
|
||||||||
|
||||||||
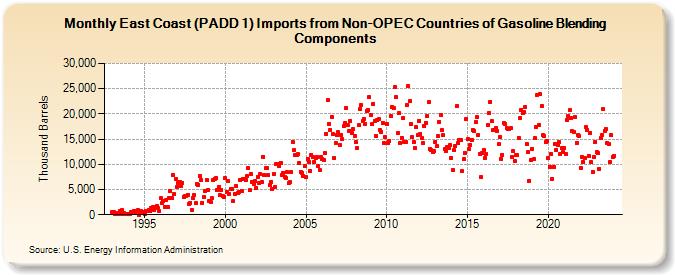
| East Coast (PADD 1) Imports from Non-OPEC Countries of Gasoline Blending Components (Thousand Barrels) | ||||||||
| Year | Jan | Feb | Mar | Apr | May | Jun | Jul | Aug | Sep | Oct | Nov | Dec |
|---|---|---|---|---|---|---|---|---|---|---|---|---|
| 1993 | 456 | 444 | 164 | 228 | 318 | 110 | 693 | 873 | 190 | 299 | 210 | 162 |
| 1994 | 147 | 184 | 489 | 300 | 733 | 293 | 656 | 868 | 33 | 681 | 362 | 453 |
| 1995 | 183 | 722 | 676 | 968 | 728 | 1,323 | 1,523 | 862 | 1,559 | 1,658 | 1,325 | 785 |
| 1996 | 3,258 | 2,288 | 2,679 | 1,542 | 2,878 | 1,628 | 3,314 | 4,776 | 3,281 | 7,854 | 4,065 | 7,133 |
| 1997 | 5,574 | 6,381 | 6,548 | 5,624 | 6,320 | 3,580 | 3,724 | 3,727 | 3,991 | 2,137 | 2,374 | 977 |
| 1998 | 3,217 | 3,908 | 2,317 | 6,074 | 5,977 | 7,609 | 6,809 | 2,353 | 3,507 | 4,708 | 6,851 | 4,891 |
| 1999 | 2,678 | 2,459 | 3,331 | 6,817 | 7,158 | 7,197 | 4,893 | 5,595 | 3,909 | 4,955 | 3,696 | 3,514 |
| 2000 | 7,197 | 4,588 | 6,616 | 4,134 | 5,182 | 5,172 | 2,670 | 4,109 | 5,648 | 4,375 | 4,547 | 6,916 |
| 2001 | 4,726 | 7,179 | 7,053 | 6,980 | 7,581 | 9,251 | 4,815 | 8,112 | 6,477 | 6,125 | 6,679 | 5,392 |
| 2002 | 7,572 | 6,274 | 8,101 | 6,439 | 11,540 | 7,826 | 9,224 | 9,176 | 7,787 | 5,844 | 6,545 | 5,164 |
| 2003 | 8,082 | 5,495 | 10,113 | 10,019 | 9,661 | 10,333 | 7,861 | 8,374 | 7,537 | 7,280 | 8,411 | 6,234 |
| 2004 | 6,402 | 8,389 | 14,376 | 12,765 | 11,889 | 11,937 | 12,017 | 10,356 | 8,446 | 8,304 | 7,695 | 9,653 |
| 2005 | 7,462 | 11,129 | 10,396 | 8,764 | 11,920 | 11,492 | 10,507 | 11,233 | 11,453 | 9,696 | 8,884 | 11,527 |
| 2006 | 11,056 | 10,946 | 12,155 | 16,103 | 22,663 | 17,996 | 16,869 | 19,466 | 15,925 | 11,258 | 14,245 | 15,827 |
| 2007 | 16,320 | 13,825 | 15,781 | 14,945 | 17,689 | 18,225 | 21,257 | 17,859 | 16,698 | 18,626 | 16,265 | 16,984 |
| 2008 | 15,703 | 14,397 | 13,225 | 17,698 | 20,884 | 21,760 | 18,577 | 19,075 | 18,079 | 20,492 | 20,870 | 23,279 |
| 2009 | 19,687 | 17,945 | 22,007 | 18,591 | 15,615 | 18,760 | 18,926 | 16,801 | 16,429 | 18,255 | 14,152 | 15,360 |
| 2010 | 18,089 | 14,149 | 14,636 | 19,569 | 21,431 | 21,088 | 25,266 | 23,261 | 16,182 | 20,147 | 14,248 | 15,292 |
| 2011 | 19,171 | 14,508 | 14,515 | 21,783 | 25,440 | 22,483 | 17,996 | 15,338 | 14,462 | 13,237 | 17,397 | 15,751 |
| 2012 | 18,683 | 16,030 | 15,243 | 14,244 | 17,548 | 18,244 | 19,554 | 22,261 | 13,106 | 12,879 | 12,390 | 12,631 |
| 2013 | 14,451 | 13,585 | 15,533 | 18,411 | 19,843 | 16,801 | 15,723 | 12,994 | 12,544 | 13,395 | 13,141 | 13,765 |
| 2014 | 11,341 | 8,892 | 12,773 | 13,603 | 21,531 | 14,178 | 14,770 | 14,865 | 8,628 | 10,985 | 12,306 | 19,034 |
| 2015 | 15,004 | 13,022 | 13,847 | 14,886 | 16,891 | 16,675 | 18,311 | 19,331 | 15,853 | 12,082 | 7,479 | 12,206 |
| 2016 | 12,862 | 11,318 | 12,079 | 17,834 | 20,186 | 22,369 | 18,587 | 16,802 | 16,717 | 17,232 | 16,538 | 13,933 |
| 2017 | 15,501 | 11,091 | 11,876 | 18,269 | 18,027 | 17,217 | 16,983 | 17,044 | 17,142 | 11,507 | 12,574 | 10,561 |
| 2018 | 11,859 | 11,885 | 15,219 | 19,144 | 20,826 | 20,115 | 20,439 | 21,372 | 13,960 | 12,426 | 6,665 | 10,821 |
| 2019 | 13,131 | 10,958 | 15,166 | 17,365 | 23,723 | 17,842 | 23,942 | 21,654 | 15,714 | 15,687 | 14,344 | 14,638 |
| 2020 | 11,217 | 9,539 | 12,110 | 7,173 | 9,433 | 14,126 | 12,891 | 13,854 | 14,372 | 12,047 | 13,213 | 12,355 |
| 2021 | 13,188 | 12,074 | 18,867 | 19,611 | 20,720 | 19,107 | 16,514 | 16,414 | 19,346 | 14,226 | 15,819 | 15,707 |
| 2022 | 9,349 | 11,547 | 10,515 | 11,277 | 17,321 | 16,770 | 11,737 | 16,283 | 10,383 | 8,482 | 11,522 | 14,491 |
| 2023 | 12,479 | 12,168 | 9,108 | 15,222 | 15,786 | 20,872 | 16,660 | 16,966 | 14,177 | 14,010 | 10,458 | 15,795 |
| 2024 | 11,466 | 11,744 | 9,584 | 13,719 | 15,872 | 16,487 | ||||||
| - = No Data Reported; -- = Not Applicable; NA = Not Available; W = Withheld to avoid disclosure of individual company data. |
| Release Date: 8/30/2024 |
| Next Release Date: 9/30/2024 |