|
Download Data (XLS File) |
|
||||||||
|
||||||||
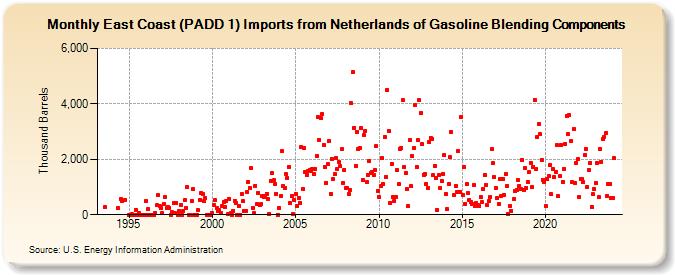
| East Coast (PADD 1) Imports from Netherlands of Gasoline Blending Components (Thousand Barrels) | ||||||||
| Year | Jan | Feb | Mar | Apr | May | Jun | Jul | Aug | Sep | Oct | Nov | Dec |
|---|---|---|---|---|---|---|---|---|---|---|---|---|
| 1993 | 267 | |||||||||||
| 1994 | 259 | 575 | 487 | 543 | ||||||||
| 1995 | 0 | 0 | 16 | 0 | 0 | 182 | 0 | 50 | 0 | 0 | 0 | 0 |
| 1996 | 488 | 0 | 199 | 0 | 0 | 0 | 0 | 58 | 340 | 707 | 323 | 250 |
| 1997 | 55 | 398 | 631 | 238 | 278 | 257 | 0 | 91 | 413 | 51 | 429 | 0 |
| 1998 | 123 | 359 | 0 | 129 | 515 | 252 | 999 | 0 | 0 | 487 | 911 | 0 |
| 1999 | 0 | 0 | 153 | 544 | 796 | 736 | 500 | 611 | 0 | 0 | 0 | 0 |
| 2000 | 45 | 352 | 519 | 244 | 150 | 164 | 73 | 311 | 458 | 287 | 506 | 14 |
| 2001 | 583 | 57 | 0 | 143 | 509 | 425 | 0 | 331 | 0 | 747 | 493 | 146 |
| 2002 | 147 | 834 | 1,187 | 979 | 1,671 | 260 | 45 | 1,051 | 373 | 796 | 351 | 373 |
| 2003 | 669 | 634 | 686 | 758 | 553 | 41 | 1,229 | 1,502 | 1,237 | 1,118 | 758 | 0 |
| 2004 | 255 | 663 | 2,283 | 1,022 | 966 | 1,457 | 1,330 | 1,735 | 407 | 667 | 29 | 517 |
| 2005 | 759 | 329 | 603 | 434 | 2,436 | 923 | 2,406 | 1,539 | 1,429 | 1,583 | 1,620 | 1,593 |
| 2006 | 1,637 | 1,479 | 1,663 | 2,123 | 3,510 | 2,713 | 3,478 | 3,625 | 2,526 | 1,732 | 1,157 | 1,825 |
| 2007 | 2,644 | 760 | 2,014 | 1,295 | 1,467 | 2,049 | 1,651 | 1,919 | 1,743 | 2,360 | 1,149 | 1,626 |
| 2008 | 977 | 951 | 745 | 901 | 4,015 | 5,140 | 3,142 | 1,775 | 2,996 | 2,384 | 2,409 | 3,116 |
| 2009 | 1,264 | 2,858 | 3,020 | 1,189 | 1,437 | 1,939 | 1,489 | 1,527 | 1,433 | 1,631 | 2,477 | 869 |
| 2010 | 626 | 1,027 | 2,046 | 1,116 | 2,821 | 1,378 | 4,510 | 3,021 | 435 | 1,843 | 635 | 499 |
| 2011 | 652 | 1,596 | 1,096 | 2,383 | 2,420 | 4,129 | 1,709 | 1,504 | 924 | 301 | 2,692 | 1,019 |
| 2012 | 2,105 | 2,422 | 3,974 | 1,733 | 2,683 | 4,130 | 3,678 | 2,545 | 1,449 | 1,478 | 1,109 | 950 |
| 2013 | 2,638 | 2,784 | 2,746 | 1,421 | 1,749 | 1,310 | 163 | 1,437 | 972 | 1,215 | 1,479 | 2,140 |
| 2014 | 765 | 200 | 1,102 | 2,071 | 2,994 | 719 | 1,053 | 822 | 2,286 | 834 | 3,523 | |
| 2015 | 706 | 1,713 | 395 | 1,095 | 787 | 542 | 465 | 396 | 1,080 | 326 | 424 | 339 |
| 2016 | 330 | 646 | 442 | 922 | 1,437 | 1,072 | 343 | 503 | 630 | 2,362 | 1,861 | 1,357 |
| 2017 | 959 | 589 | 397 | 1,277 | 678 | 1,296 | 722 | 1,474 | 1,031 | 30 | 321 | 143 |
| 2018 | 561 | 842 | 907 | 1,238 | 1,041 | 928 | 1,979 | 879 | 1,702 | 976 | 1,188 | |
| 2019 | 1,530 | 1,882 | 997 | 1,731 | 4,154 | 1,658 | 2,819 | 3,264 | 2,897 | 1,983 | 1,264 | 1,193 |
| 2020 | 321 | 1,271 | 1,383 | 1,793 | 737 | 1,655 | 1,360 | 1,542 | 2,509 | 659 | 1,394 | 2,521 |
| 2021 | 1,197 | 1,665 | 2,565 | 3,567 | 2,897 | 3,592 | 2,645 | 1,164 | 3,094 | 1,140 | 1,880 | 2,004 |
| 2022 | 640 | 1,302 | 1,286 | 1,173 | 2,156 | 2,364 | 1,007 | 1,627 | 1,882 | 282 | 738 | 935 |
| 2023 | 1,151 | 1,874 | 634 | 2,388 | 1,919 | 2,727 | 2,817 | 2,936 | 679 | 1,123 | 1,108 | 617 |
| 2024 | 620 | |||||||||||
| - = No Data Reported; -- = Not Applicable; NA = Not Available; W = Withheld to avoid disclosure of individual company data. |
| Release Date: 3/29/2024 |
| Next Release Date: 4/30/2024 |