|
Download Data (XLS File) |
|
||||||||
|
||||||||
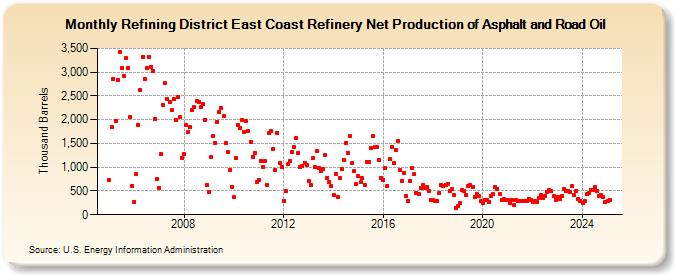
| Refining District East Coast Refinery Net Production of Asphalt and Road Oil (Thousand Barrels) | ||||||||
| Year | Jan | Feb | Mar | Apr | May | Jun | Jul | Aug | Sep | Oct | Nov | Dec |
|---|---|---|---|---|---|---|---|---|---|---|---|---|
| 2005 | 727 | 1,837 | 2,864 | 1,969 | 2,831 | 3,423 | 3,087 | 2,917 | 3,295 | 3,089 | 2,065 | 607 |
| 2006 | 275 | 849 | 1,892 | 2,623 | 3,321 | 2,865 | 3,082 | 3,321 | 3,113 | 3,031 | 2,017 | 749 |
| 2007 | 561 | 1,275 | 2,319 | 2,766 | 2,438 | 2,372 | 2,197 | 2,437 | 2,003 | 2,472 | 2,059 | 1,187 |
| 2008 | 1,283 | 1,884 | 1,749 | 1,837 | 2,204 | 2,257 | 2,383 | 2,373 | 2,271 | 2,334 | 2,000 | 629 |
| 2009 | 485 | 1,205 | 1,666 | 1,517 | 1,953 | 2,160 | 2,240 | 2,069 | 1,502 | 1,313 | 940 | 589 |
| 2010 | 367 | 1,197 | 1,889 | 1,835 | 1,988 | 1,744 | 1,974 | 1,766 | 1,535 | 1,224 | 1,301 | 684 |
| 2011 | 729 | 1,125 | 1,001 | 1,125 | 627 | 1,712 | 1,764 | 1,384 | 939 | 1,729 | 1,086 | 1,002 |
| 2012 | 293 | 509 | 1,060 | 1,130 | 1,317 | 1,421 | 1,608 | 1,301 | 994 | 1,021 | 1,090 | 1,053 |
| 2013 | 702 | 617 | 1,188 | 997 | 1,350 | 989 | 917 | 970 | 1,256 | 780 | 697 | 595 |
| 2014 | 414 | 858 | 369 | 773 | 952 | 1,159 | 1,510 | 1,296 | 1,652 | 1,079 | 913 | 644 |
| 2015 | 824 | 679 | 767 | 615 | 1,116 | 1,118 | 1,409 | 1,661 | 1,416 | 1,427 | 1,143 | 781 |
| 2016 | 729 | 983 | 613 | 1,166 | 1,432 | 1,087 | 1,359 | 1,560 | 946 | 707 | 871 | 393 |
| 2017 | 283 | 713 | 993 | 854 | 462 | 436 | 572 | 623 | 569 | 573 | 507 | 315 |
| 2018 | 301 | 283 | 292 | 449 | 629 | 609 | 635 | 652 | 507 | 536 | 414 | 144 |
| 2019 | 184 | 239 | 524 | 491 | 420 | 612 | 625 | 578 | 376 | 431 | 388 | 279 |
| 2020 | 252 | 303 | 301 | 275 | 401 | 426 | 573 | 537 | 426 | 301 | 338 | 316 |
| 2021 | 308 | 254 | 315 | 196 | 306 | 291 | 296 | 290 | 289 | 292 | 336 | 304 |
| 2022 | 273 | 292 | 275 | 354 | 423 | 349 | 393 | 478 | 511 | 491 | 389 | 313 |
| 2023 | 369 | 331 | 403 | 551 | 498 | 498 | 485 | 594 | 412 | 494 | 330 | 298 |
| 2024 | 239 | |||||||||||
| - = No Data Reported; -- = Not Applicable; NA = Not Available; W = Withheld to avoid disclosure of individual company data. |
| Release Date: 3/29/2024 |
| Next Release Date: 4/30/2024 |