|
Download Data (XLS File) |
|
||||||||
|
||||||||
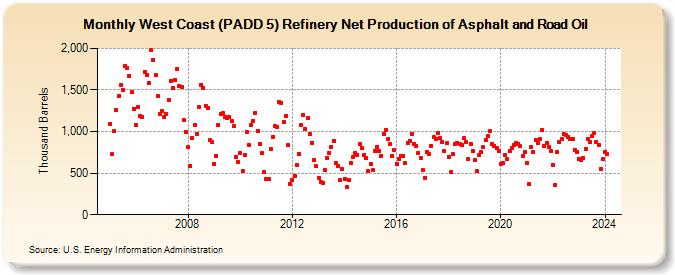
| West Coast (PADD 5) Refinery Net Production of Asphalt and Road Oil (Thousand Barrels) | ||||||||
| Year | Jan | Feb | Mar | Apr | May | Jun | Jul | Aug | Sep | Oct | Nov | Dec |
|---|---|---|---|---|---|---|---|---|---|---|---|---|
| 2005 | 1,085 | 730 | 1,006 | 1,257 | 1,424 | 1,562 | 1,505 | 1,793 | 1,764 | 1,669 | 1,470 | 1,275 |
| 2006 | 1,081 | 1,293 | 1,192 | 1,176 | 1,722 | 1,680 | 1,589 | 1,975 | 1,865 | 1,679 | 1,422 | 1,206 |
| 2007 | 1,249 | 1,170 | 1,210 | 1,380 | 1,612 | 1,520 | 1,621 | 1,755 | 1,549 | 1,536 | 1,143 | 998 |
| 2008 | 809 | 586 | 923 | 1,079 | 968 | 1,301 | 1,559 | 1,522 | 1,310 | 1,280 | 893 | 870 |
| 2009 | 609 | 711 | 1,073 | 1,209 | 1,228 | 1,176 | 1,159 | 1,177 | 1,127 | 1,064 | 698 | 630 |
| 2010 | 746 | 523 | 722 | 996 | 840 | 1,076 | 1,126 | 1,227 | 1,007 | 846 | 744 | 512 |
| 2011 | 429 | 435 | 792 | 936 | 1,071 | 1,055 | 1,361 | 1,342 | 1,113 | 1,187 | 834 | 369 |
| 2012 | 415 | 467 | 602 | 736 | 1,073 | 1,201 | 1,031 | 1,165 | 968 | 868 | 652 | 580 |
| 2013 | 444 | 399 | 380 | 533 | 684 | 745 | 818 | 890 | 616 | 584 | 412 | 544 |
| 2014 | 432 | 329 | 422 | 627 | 699 | 748 | 721 | 852 | 807 | 724 | 684 | 523 |
| 2015 | 605 | 533 | 763 | 816 | 770 | 711 | 969 | 1,014 | 907 | 851 | 706 | 777 |
| 2016 | 611 | 666 | 710 | 712 | 616 | 861 | 888 | 967 | 846 | 831 | 746 | 687 |
| 2017 | 543 | 445 | 757 | 726 | 827 | 931 | 913 | 983 | 919 | 875 | 772 | 858 |
| 2018 | 698 | 513 | 727 | 849 | 861 | 849 | 843 | 919 | 869 | 674 | 856 | 770 |
| 2019 | 657 | 522 | 716 | 749 | 814 | 903 | 947 | 1,003 | 847 | 828 | 801 | 765 |
| 2020 | 614 | 617 | 715 | 665 | 769 | 807 | 844 | 868 | 853 | 822 | 704 | 759 |
| 2021 | 625 | 367 | 819 | 755 | 896 | 858 | 907 | 1,017 | 821 | 861 | 809 | 761 |
| 2022 | 592 | 354 | 754 | 869 | 909 | 970 | 960 | 939 | 905 | 915 | 784 | 749 |
| 2023 | 671 | 662 | 680 | 789 | 911 | 872 | 952 | 988 | 878 | 844 | 555 | 668 |
| 2024 | 753 | |||||||||||
| - = No Data Reported; -- = Not Applicable; NA = Not Available; W = Withheld to avoid disclosure of individual company data. |
| Release Date: 3/29/2024 |
| Next Release Date: 4/30/2024 |