|
Download Data (XLS File) |
|
||||||||
|
||||||||
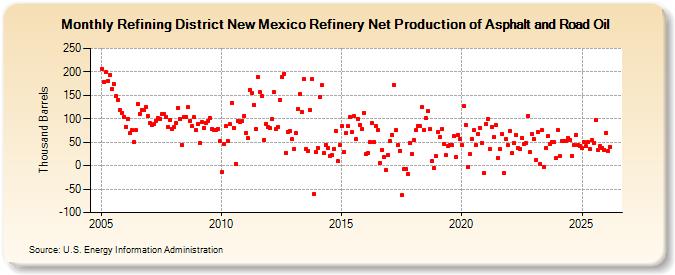
| Refining District New Mexico Refinery Net Production of Asphalt and Road Oil (Thousand Barrels) | ||||||||
| Year | Jan | Feb | Mar | Apr | May | Jun | Jul | Aug | Sep | Oct | Nov | Dec |
|---|---|---|---|---|---|---|---|---|---|---|---|---|
| 2005 | 207 | 179 | 199 | 181 | 194 | 164 | 175 | 148 | 141 | 119 | 113 | 103 |
| 2006 | 83 | 100 | 69 | 75 | 51 | 76 | 132 | 110 | 119 | 118 | 125 | 105 |
| 2007 | 91 | 86 | 88 | 96 | 101 | 99 | 110 | 110 | 104 | 83 | 98 | 79 |
| 2008 | 82 | 90 | 123 | 99 | 45 | 104 | 104 | 124 | 96 | 84 | 103 | 75 |
| 2009 | 89 | 48 | 93 | 81 | 92 | 95 | 102 | 79 | 76 | 76 | 79 | 52 |
| 2010 | -14 | 46 | 84 | 53 | 88 | 134 | 81 | 4 | 96 | 94 | 95 | 106 |
| 2011 | 70 | 58 | 162 | 155 | 130 | 78 | 189 | 156 | 148 | 55 | 89 | 82 |
| 2012 | 80 | 99 | 157 | 78 | 82 | 141 | 189 | 196 | 28 | 72 | 74 | 56 |
| 2013 | 36 | 69 | 121 | 153 | 115 | 184 | 36 | 31 | 119 | 184 | -60 | 29 |
| 2014 | 38 | 146 | 171 | 27 | 45 | 38 | 21 | 22 | 36 | 74 | 9 | 44 |
| 2015 | 84 | 29 | 69 | 84 | 103 | 71 | 105 | 56 | 100 | 87 | 78 | 113 |
| 2016 | 24 | 26 | 51 | 90 | 50 | 84 | 76 | 6 | 34 | 18 | -9 | 22 |
| 2017 | 52 | 66 | 172 | 75 | 43 | 32 | -63 | -8 | -7 | -18 | 49 | 25 |
| 2018 | 55 | 75 | 85 | 84 | 125 | 76 | 101 | 117 | 78 | 10 | -6 | 20 |
| 2019 | 72 | 61 | 78 | 47 | 22 | 42 | 45 | 45 | 63 | 19 | 65 | 56 |
| 2020 | 44 | 127 | 87 | -2 | 24 | 57 | 75 | 45 | 68 | 81 | 49 | -16 |
| 2021 | 89 | 100 | 35 | 83 | 61 | 86 | 17 | 35 | 68 | -15 | 57 | 43 |
| 2022 | 74 | 26 | 48 | 66 | 38 | 36 | 59 | 46 | 48 | 106 | 29 | 68 |
| 2023 | 56 | 13 | 72 | 4 | 76 | -2 | 38 | 63 | 46 | 51 | 50 | 16 |
| 2024 | 75 | 20 | 53 | 53 | 53 | 59 | ||||||
| - = No Data Reported; -- = Not Applicable; NA = Not Available; W = Withheld to avoid disclosure of individual company data. |
| Release Date: 8/30/2024 |
| Next Release Date: 9/30/2024 |