|
Download Data (XLS File) |
|
||||||||
|
||||||||
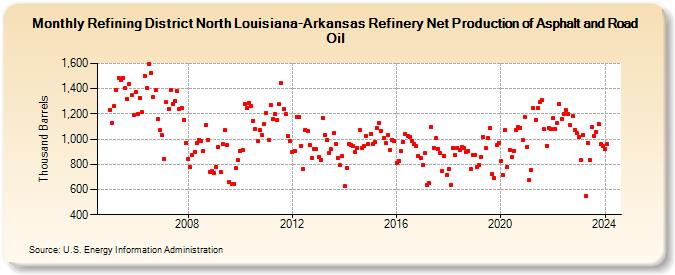
| Refining District North Louisiana-Arkansas Refinery Net Production of Asphalt and Road Oil (Thousand Barrels) | ||||||||
| Year | Jan | Feb | Mar | Apr | May | Jun | Jul | Aug | Sep | Oct | Nov | Dec |
|---|---|---|---|---|---|---|---|---|---|---|---|---|
| 2005 | 1,234 | 1,129 | 1,264 | 1,392 | 1,487 | 1,468 | 1,483 | 1,403 | 1,320 | 1,439 | 1,347 | 1,188 |
| 2006 | 1,376 | 1,203 | 1,329 | 1,212 | 1,502 | 1,405 | 1,597 | 1,527 | 1,333 | 1,388 | 1,156 | 1,072 |
| 2007 | 1,030 | 844 | 1,291 | 1,240 | 1,388 | 1,281 | 1,305 | 1,379 | 1,238 | 1,247 | 1,151 | 969 |
| 2008 | 845 | 775 | 871 | 899 | 966 | 995 | 984 | 903 | 1,111 | 994 | 739 | 744 |
| 2009 | 731 | 780 | 936 | 741 | 958 | 1,069 | 955 | 660 | 644 | 647 | 771 | 831 |
| 2010 | 902 | 913 | 1,278 | 1,243 | 1,285 | 1,261 | 1,145 | 1,079 | 986 | 1,071 | 1,034 | 1,120 |
| 2011 | 1,206 | 995 | 1,271 | 1,159 | 1,197 | 1,155 | 1,275 | 1,444 | 1,235 | 1,196 | 1,024 | 982 |
| 2012 | 895 | 908 | 1,178 | 1,173 | 948 | 764 | 1,074 | 1,064 | 950 | 852 | 919 | 918 |
| 2013 | 855 | 832 | 1,171 | 1,036 | 994 | 892 | 921 | 1,046 | 963 | 853 | 791 | 867 |
| 2014 | 625 | 774 | 964 | 955 | 944 | 898 | 932 | 1,076 | 931 | 946 | 1,025 | 963 |
| 2015 | 1,041 | 963 | 974 | 1,090 | 1,126 | 1,068 | 1,010 | 967 | 1,030 | 912 | 996 | 985 |
| 2016 | 814 | 825 | 909 | 980 | 1,037 | 1,026 | 1,020 | 986 | 960 | 944 | 868 | 849 |
| 2017 | 795 | 886 | 633 | 649 | 1,096 | 933 | 1,005 | 924 | 887 | 750 | 868 | 713 |
| 2018 | 764 | 638 | 927 | 872 | 933 | 913 | 939 | 929 | 901 | 906 | 761 | 875 |
| 2019 | 870 | 778 | 797 | 856 | 1,018 | 927 | 1,011 | 1,087 | 725 | 693 | 953 | 972 |
| 2020 | 824 | 714 | 1,074 | 776 | 917 | 859 | 907 | 1,072 | 1,094 | 1,089 | 996 | 1,177 |
| 2021 | 940 | 672 | 754 | 1,244 | 1,153 | 1,244 | 1,291 | 1,307 | 1,078 | 949 | 1,090 | 1,079 |
| 2022 | 1,164 | 1,080 | 1,129 | 1,280 | 1,161 | 1,202 | 1,232 | 1,202 | 1,113 | 1,181 | 1,075 | 1,048 |
| 2023 | 1,015 | 831 | 1,034 | 548 | 973 | 834 | 1,097 | 1,021 | 1,058 | 1,121 | 959 | 943 |
| 2024 | 923 | |||||||||||
| - = No Data Reported; -- = Not Applicable; NA = Not Available; W = Withheld to avoid disclosure of individual company data. |
| Release Date: 3/29/2024 |
| Next Release Date: 4/30/2024 |