|
Download Data (XLS File) |
|
||||||||
|
||||||||
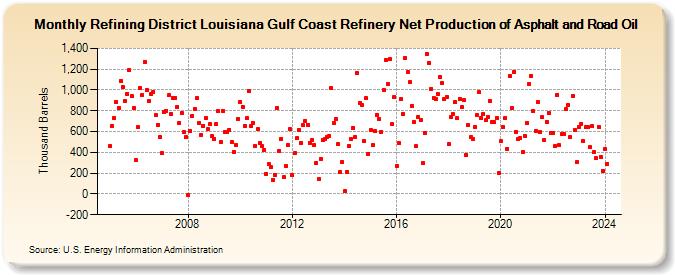
| Refining District Louisiana Gulf Coast Refinery Net Production of Asphalt and Road Oil (Thousand Barrels) | ||||||||
| Year | Jan | Feb | Mar | Apr | May | Jun | Jul | Aug | Sep | Oct | Nov | Dec |
|---|---|---|---|---|---|---|---|---|---|---|---|---|
| 2005 | 462 | 655 | 728 | 887 | 826 | 1,090 | 1,032 | 895 | 966 | 1,192 | 938 | 831 |
| 2006 | 326 | 643 | 1,017 | 952 | 1,272 | 1,002 | 892 | 961 | 982 | 755 | 667 | 548 |
| 2007 | 390 | 785 | 801 | 947 | 768 | 927 | 927 | 840 | 687 | 774 | 591 | 545 |
| 2008 | -12 | 603 | 751 | 817 | 918 | 684 | 571 | 656 | 732 | 621 | 672 | 558 |
| 2009 | 528 | 668 | 794 | 497 | 798 | 600 | 600 | 615 | 497 | 405 | 470 | 721 |
| 2010 | 886 | 840 | 654 | 727 | 988 | 649 | 685 | 462 | 622 | 488 | 457 | 427 |
| 2011 | 196 | 290 | 257 | 135 | 185 | 826 | 414 | 531 | 158 | 269 | 472 | 621 |
| 2012 | 180 | 391 | 534 | 614 | 493 | 660 | 706 | 667 | 494 | 519 | 474 | 297 |
| 2013 | 140 | 336 | 519 | 530 | 550 | 558 | 1,015 | 683 | 722 | 477 | 209 | 308 |
| 2014 | 24 | 214 | 459 | 529 | 637 | 549 | 1,159 | 873 | 857 | 508 | 920 | 387 |
| 2015 | 613 | 467 | 602 | 762 | 720 | 597 | 999 | 1,291 | 1,054 | 1,295 | 668 | 932 |
| 2016 | 271 | 488 | 912 | 767 | 1,309 | 1,169 | 1,073 | 844 | 691 | 457 | 740 | 712 |
| 2017 | 299 | 583 | 1,346 | 1,260 | 1,013 | 923 | 909 | 960 | 1,123 | 1,065 | 914 | 930 |
| 2018 | 478 | 744 | 767 | 884 | 727 | 913 | 834 | 903 | 375 | 663 | 547 | 531 |
| 2019 | 647 | 761 | 976 | 729 | 768 | 708 | 743 | 893 | 688 | 689 | 731 | 200 |
| 2020 | 506 | 644 | 732 | 436 | 1,134 | 824 | 1,176 | 599 | 532 | 537 | 399 | 558 |
| 2021 | 680 | 1,059 | 1,137 | 797 | 608 | 883 | 593 | 736 | 521 | 695 | 779 | 589 |
| 2022 | 588 | 459 | 956 | 466 | 581 | 573 | 814 | 853 | 545 | 944 | 618 | 306 |
| 2023 | 646 | 676 | 506 | 640 | 644 | 450 | 654 | 402 | 343 | 648 | 358 | 223 |
| 2024 | 432 | |||||||||||
| - = No Data Reported; -- = Not Applicable; NA = Not Available; W = Withheld to avoid disclosure of individual company data. |
| Release Date: 3/29/2024 |
| Next Release Date: 4/30/2024 |