|
Download Data (XLS File) |
|
||||||||
|
||||||||
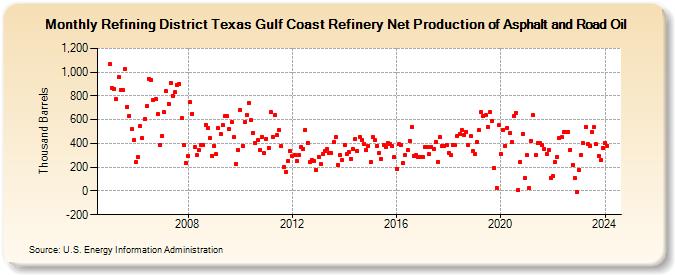
| Refining District Texas Gulf Coast Refinery Net Production of Asphalt and Road Oil (Thousand Barrels) | ||||||||
| Year | Jan | Feb | Mar | Apr | May | Jun | Jul | Aug | Sep | Oct | Nov | Dec |
|---|---|---|---|---|---|---|---|---|---|---|---|---|
| 2005 | 1,068 | 867 | 859 | 773 | 958 | 850 | 849 | 1,024 | 708 | 633 | 522 | 431 |
| 2006 | 241 | 282 | 543 | 445 | 605 | 712 | 945 | 930 | 768 | 772 | 649 | 383 |
| 2007 | 466 | 662 | 839 | 736 | 909 | 802 | 830 | 894 | 903 | 614 | 385 | 239 |
| 2008 | 294 | 746 | 650 | 370 | 299 | 346 | 383 | 390 | 559 | 528 | 445 | 298 |
| 2009 | 378 | 311 | 529 | 479 | 555 | 627 | 628 | 519 | 577 | 452 | 230 | 348 |
| 2010 | 683 | 381 | 577 | 642 | 744 | 594 | 490 | 402 | 427 | 348 | 457 | 316 |
| 2011 | 439 | 363 | 662 | 457 | 637 | 472 | 511 | 375 | 204 | 160 | 253 | 333 |
| 2012 | 298 | 303 | 251 | 302 | 367 | 353 | 515 | 405 | 243 | 261 | 250 | 180 |
| 2013 | 288 | 227 | 311 | 334 | 352 | 316 | 318 | 408 | 450 | 219 | 300 | 259 |
| 2014 | 386 | 310 | 325 | 272 | 350 | 437 | 336 | 455 | 431 | 398 | 343 | 380 |
| 2015 | 243 | 454 | 425 | 382 | 323 | 269 | 391 | 373 | 407 | 393 | 375 | 286 |
| 2016 | 188 | 393 | 388 | 235 | 304 | 342 | 424 | 537 | 298 | 302 | 287 | 283 |
| 2017 | 285 | 366 | 371 | 311 | 368 | 356 | 413 | 246 | 450 | 380 | 377 | 388 |
| 2018 | 322 | 299 | 386 | 384 | 464 | 479 | 514 | 473 | 500 | 388 | 461 | 336 |
| 2019 | 307 | 410 | 513 | 662 | 627 | 636 | 540 | 661 | 591 | 194 | 29 | 554 |
| 2020 | 313 | 516 | 382 | 534 | 487 | 412 | 634 | 659 | 6 | 245 | 480 | 110 |
| 2021 | 299 | 21 | 424 | 637 | 299 | 400 | 401 | 388 | 354 | 312 | 348 | 108 |
| 2022 | 123 | 240 | 288 | 444 | 450 | 496 | 500 | 498 | 348 | 221 | 109 | -7 |
| 2023 | 178 | 305 | 401 | 539 | 397 | 381 | 499 | 535 | 393 | 291 | 258 | 364 |
| 2024 | 402 | 381 | 270 | 386 | 504 | 296 | ||||||
| - = No Data Reported; -- = Not Applicable; NA = Not Available; W = Withheld to avoid disclosure of individual company data. |
| Release Date: 8/30/2024 |
| Next Release Date: 9/30/2024 |