|
Download Data (XLS File) |
|
||||||||
|
||||||||
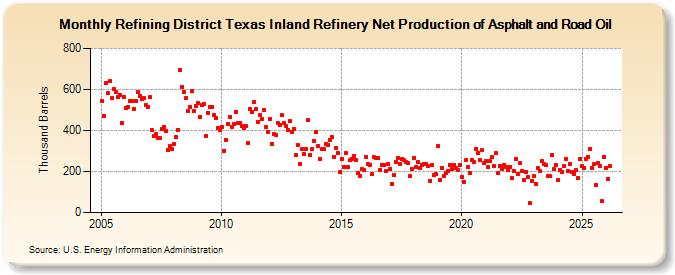
| Refining District Texas Inland Refinery Net Production of Asphalt and Road Oil (Thousand Barrels) | ||||||||
| Year | Jan | Feb | Mar | Apr | May | Jun | Jul | Aug | Sep | Oct | Nov | Dec |
|---|---|---|---|---|---|---|---|---|---|---|---|---|
| 2005 | 544 | 469 | 629 | 583 | 641 | 557 | 604 | 588 | 561 | 572 | 438 | 564 |
| 2006 | 509 | 516 | 546 | 542 | 506 | 545 | 586 | 567 | 553 | 558 | 522 | 516 |
| 2007 | 561 | 403 | 371 | 381 | 361 | 362 | 405 | 416 | 397 | 304 | 322 | 308 |
| 2008 | 335 | 367 | 404 | 695 | 610 | 588 | 559 | 493 | 516 | 591 | 497 | 521 |
| 2009 | 532 | 468 | 524 | 530 | 372 | 487 | 515 | 513 | 474 | 459 | 413 | 403 |
| 2010 | 416 | 302 | 356 | 432 | 465 | 418 | 432 | 489 | 435 | 438 | 420 | 412 |
| 2011 | 420 | 337 | 506 | 489 | 541 | 503 | 443 | 474 | 454 | 502 | 417 | 394 |
| 2012 | 458 | 336 | 381 | 376 | 437 | 427 | 474 | 438 | 420 | 400 | 445 | 391 |
| 2013 | 408 | 282 | 329 | 237 | 310 | 284 | 309 | 452 | 281 | 309 | 349 | 392 |
| 2014 | 325 | 262 | 309 | 309 | 332 | 330 | 354 | 368 | 270 | 317 | 291 | 196 |
| 2015 | 262 | 221 | 289 | 221 | 256 | 261 | 278 | 257 | 191 | 177 | 211 | 208 |
| 2016 | 273 | 238 | 234 | 187 | 270 | 264 | 266 | 209 | 232 | 232 | 204 | 235 |
| 2017 | 213 | 139 | 184 | 248 | 268 | 237 | 259 | 255 | 248 | 241 | 176 | 210 |
| 2018 | 266 | 220 | 246 | 217 | 234 | 236 | 239 | 226 | 154 | 232 | 182 | 189 |
| 2019 | 324 | 158 | 218 | 180 | 195 | 204 | 232 | 210 | 232 | 217 | 205 | 234 |
| 2020 | 175 | 151 | 254 | 224 | 191 | 256 | 248 | 310 | 291 | 255 | 303 | 242 |
| 2021 | 251 | 222 | 252 | 270 | 227 | 289 | 192 | 228 | 212 | 231 | 221 | 207 |
| 2022 | 224 | 168 | 204 | 263 | 188 | 240 | 201 | 160 | 199 | 172 | 49 | 153 |
| 2023 | 176 | 137 | 217 | 203 | 249 | 237 | 231 | 177 | 179 | 280 | 210 | 231 |
| 2024 | 157 | |||||||||||
| - = No Data Reported; -- = Not Applicable; NA = Not Available; W = Withheld to avoid disclosure of individual company data. |
| Release Date: 3/29/2024 |
| Next Release Date: 4/30/2024 |