|
Download Data (XLS File) |
|
||||||||
|
||||||||
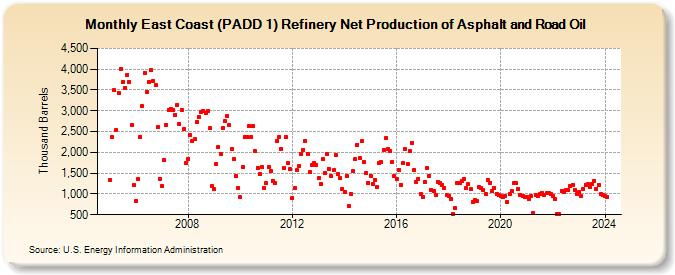
| East Coast (PADD 1) Refinery Net Production of Asphalt and Road Oil (Thousand Barrels) | ||||||||
| Year | Jan | Feb | Mar | Apr | May | Jun | Jul | Aug | Sep | Oct | Nov | Dec |
|---|---|---|---|---|---|---|---|---|---|---|---|---|
| 2005 | 1,335 | 2,370 | 3,489 | 2,533 | 3,427 | 4,000 | 3,703 | 3,549 | 3,872 | 3,687 | 2,658 | 1,215 |
| 2006 | 836 | 1,355 | 2,377 | 3,105 | 3,915 | 3,462 | 3,696 | 3,972 | 3,711 | 3,611 | 2,605 | 1,367 |
| 2007 | 1,186 | 1,806 | 2,661 | 3,022 | 3,037 | 3,012 | 2,908 | 3,145 | 2,678 | 3,029 | 2,557 | 1,744 |
| 2008 | 1,847 | 2,413 | 2,270 | 2,311 | 2,736 | 2,851 | 2,978 | 2,999 | 2,937 | 2,987 | 2,574 | 1,194 |
| 2009 | 1,112 | 1,714 | 2,125 | 1,967 | 2,597 | 2,752 | 2,881 | 2,666 | 2,090 | 1,844 | 1,430 | 1,152 |
| 2010 | 918 | 1,650 | 2,363 | 2,379 | 2,631 | 2,377 | 2,627 | 2,024 | 1,632 | 1,469 | 1,648 | 1,154 |
| 2011 | 1,260 | 1,656 | 1,544 | 1,321 | 1,253 | 2,279 | 2,374 | 2,071 | 1,625 | 2,367 | 1,748 | 1,590 |
| 2012 | 908 | 1,133 | 1,568 | 1,663 | 1,968 | 2,066 | 2,276 | 1,971 | 1,525 | 1,688 | 1,741 | 1,707 |
| 2013 | 1,373 | 1,241 | 1,833 | 1,512 | 1,970 | 1,602 | 1,428 | 1,566 | 1,930 | 1,474 | 1,371 | 1,125 |
| 2014 | 1,051 | 1,430 | 701 | 1,008 | 1,540 | 1,828 | 2,184 | 1,860 | 2,262 | 1,769 | 1,506 | 1,272 |
| 2015 | 1,438 | 1,239 | 1,346 | 1,158 | 1,737 | 1,757 | 2,057 | 2,341 | 2,085 | 2,030 | 1,768 | 1,430 |
| 2016 | 1,362 | 1,578 | 1,225 | 1,744 | 2,070 | 1,722 | 2,032 | 2,233 | 1,581 | 1,294 | 1,365 | 987 |
| 2017 | 932 | 1,287 | 1,627 | 1,443 | 1,095 | 1,064 | 982 | 1,294 | 1,252 | 1,220 | 1,139 | 972 |
| 2018 | 960 | 879 | 529 | 658 | 1,262 | 1,255 | 1,311 | 1,366 | 1,145 | 1,228 | 1,109 | 806 |
| 2019 | 850 | 822 | 1,162 | 1,142 | 1,092 | 1,000 | 1,329 | 1,269 | 1,072 | 1,154 | 1,006 | 972 |
| 2020 | 950 | 918 | 950 | 812 | 996 | 1,059 | 1,267 | 1,255 | 1,127 | 970 | 950 | 930 |
| 2021 | 930 | 869 | 946 | 550 | 967 | 941 | 999 | 1,031 | 986 | 1,013 | 1,011 | 997 |
| 2022 | 947 | 869 | 525 | 515 | 1,072 | 1,056 | 1,087 | 1,095 | 1,182 | 1,224 | 1,095 | 992 |
| 2023 | 1,045 | 941 | 1,120 | 1,223 | 1,227 | 1,172 | 1,234 | 1,318 | 1,124 | 1,220 | 998 | 982 |
| 2024 | 941 | 931 | 1,005 | 1,047 | 1,170 | 1,219 | ||||||
| - = No Data Reported; -- = Not Applicable; NA = Not Available; W = Withheld to avoid disclosure of individual company data. |
| Release Date: 8/30/2024 |
| Next Release Date: 9/30/2024 |