|
Download Data (XLS File) |
|
||||||||
|
||||||||
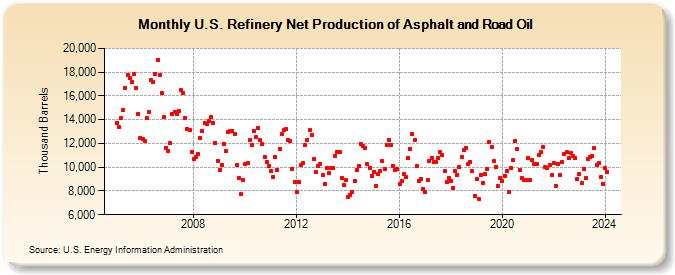
| U.S. Refinery Net Production of Asphalt and Road Oil (Thousand Barrels) | ||||||||
| Year | Jan | Feb | Mar | Apr | May | Jun | Jul | Aug | Sep | Oct | Nov | Dec |
|---|---|---|---|---|---|---|---|---|---|---|---|---|
| 2005 | 13,754 | 13,349 | 14,165 | 14,818 | 16,694 | 17,795 | 17,500 | 17,180 | 17,833 | 16,670 | 14,504 | 12,474 |
| 2006 | 12,408 | 12,213 | 14,168 | 14,657 | 17,350 | 17,163 | 17,845 | 19,025 | 17,787 | 16,240 | 14,217 | 11,638 |
| 2007 | 11,386 | 12,002 | 14,445 | 14,648 | 14,464 | 14,708 | 16,466 | 16,277 | 14,164 | 13,255 | 13,147 | 11,308 |
| 2008 | 10,713 | 10,894 | 11,094 | 12,474 | 13,057 | 13,688 | 13,656 | 13,866 | 14,184 | 13,758 | 12,067 | 10,559 |
| 2009 | 9,805 | 10,158 | 11,955 | 11,366 | 12,955 | 13,009 | 13,066 | 12,823 | 10,167 | 9,050 | 7,710 | 8,907 |
| 2010 | 10,277 | 10,314 | 12,287 | 11,886 | 13,038 | 12,500 | 13,326 | 12,298 | 11,916 | 10,861 | 10,431 | 10,068 |
| 2011 | 9,661 | 9,200 | 10,886 | 9,752 | 11,566 | 12,785 | 13,138 | 13,200 | 12,328 | 12,163 | 9,873 | 8,758 |
| 2012 | 7,882 | 8,769 | 10,152 | 10,351 | 11,826 | 12,298 | 13,106 | 12,699 | 10,664 | 9,567 | 10,066 | 10,269 |
| 2013 | 9,321 | 8,596 | 9,973 | 9,494 | 9,914 | 9,923 | 10,961 | 11,314 | 11,301 | 9,119 | 8,541 | 8,894 |
| 2014 | 7,475 | 7,685 | 7,922 | 8,831 | 9,805 | 10,072 | 11,990 | 11,753 | 11,645 | 10,246 | 9,957 | 9,281 |
| 2015 | 9,622 | 8,430 | 9,436 | 9,676 | 10,533 | 9,841 | 11,854 | 12,303 | 11,909 | 10,122 | 9,768 | 9,874 |
| 2016 | 8,563 | 8,831 | 9,426 | 9,135 | 10,791 | 11,534 | 12,804 | 12,274 | 10,113 | 8,854 | 9,011 | 8,174 |
| 2017 | 7,942 | 8,888 | 10,521 | 10,795 | 10,441 | 10,429 | 10,799 | 11,249 | 11,052 | 9,667 | 8,735 | 9,084 |
| 2018 | 8,873 | 8,276 | 9,687 | 9,334 | 9,977 | 10,867 | 11,434 | 11,654 | 10,240 | 10,442 | 9,638 | 7,541 |
| 2019 | 9,038 | 7,336 | 9,326 | 8,693 | 9,400 | 9,808 | 12,142 | 11,680 | 10,492 | 9,980 | 8,384 | 9,085 |
| 2020 | 8,814 | 9,274 | 9,701 | 7,902 | 9,946 | 10,596 | 12,228 | 11,509 | 9,769 | 9,130 | 8,955 | 8,901 |
| 2021 | 10,741 | 8,916 | 10,638 | 10,244 | 10,260 | 11,024 | 11,277 | 11,737 | 9,977 | 9,942 | 10,167 | 9,334 |
| 2022 | 10,354 | 8,440 | 10,255 | 9,316 | 10,474 | 11,130 | 11,252 | 10,813 | 11,186 | 10,961 | 10,806 | 9,015 |
| 2023 | 9,461 | 8,648 | 9,870 | 9,068 | 10,713 | 10,879 | 10,956 | 11,597 | 10,153 | 10,386 | 9,168 | 8,620 |
| 2024 | 9,946 | |||||||||||
| - = No Data Reported; -- = Not Applicable; NA = Not Available; W = Withheld to avoid disclosure of individual company data. |
| Release Date: 3/29/2024 |
| Next Release Date: 4/30/2024 |