|
Download Data (XLS File) |
|
||||||||
|
||||||||
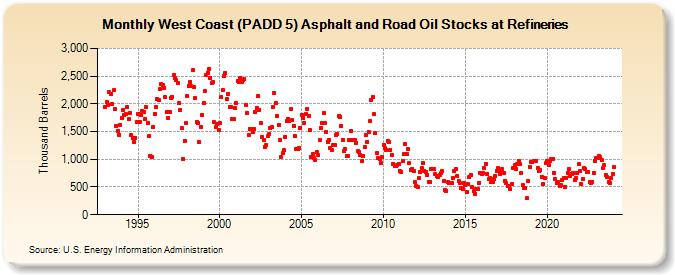
| West Coast (PADD 5) Asphalt and Road Oil Stocks at Refineries (Thousand Barrels) | ||||||||
| Year | Jan | Feb | Mar | Apr | May | Jun | Jul | Aug | Sep | Oct | Nov | Dec |
|---|---|---|---|---|---|---|---|---|---|---|---|---|
| 1993 | 1,942 | 2,027 | 1,985 | 2,208 | 2,178 | 1,997 | 2,241 | 1,900 | 1,605 | 1,511 | 1,440 | 1,627 |
| 1994 | 1,748 | 1,895 | 1,790 | 1,816 | 1,937 | 1,725 | 1,837 | 1,431 | 1,391 | 1,312 | 1,390 | 1,675 |
| 1995 | 1,824 | 1,674 | 1,790 | 1,864 | 1,861 | 1,722 | 1,936 | 1,658 | 1,423 | 1,065 | 1,049 | 1,582 |
| 1996 | 1,822 | 1,950 | 2,090 | 2,065 | 2,261 | 2,351 | 2,334 | 2,294 | 2,116 | 1,855 | 1,752 | 1,854 |
| 1997 | 2,097 | 2,129 | 2,524 | 2,470 | 2,423 | 2,381 | 2,007 | 1,891 | 1,558 | 1,002 | 1,333 | 1,651 |
| 1998 | 2,150 | 2,320 | 2,396 | 2,317 | 2,603 | 2,298 | 2,109 | 1,681 | 1,650 | 1,308 | 1,589 | 1,800 |
| 1999 | 2,008 | 2,229 | 2,513 | 2,557 | 2,629 | 2,471 | 2,372 | 2,394 | 1,664 | 1,580 | 1,639 | 1,522 |
| 2000 | 1,649 | 2,116 | 2,244 | 2,496 | 2,553 | 2,090 | 2,185 | 1,942 | 1,940 | 1,731 | 1,721 | 1,924 |
| 2001 | 2,008 | 2,409 | 2,398 | 2,472 | 2,402 | 2,427 | 2,440 | 1,986 | 1,833 | 1,441 | 1,551 | 1,554 |
| 2002 | 1,484 | 1,551 | 1,850 | 1,926 | 2,144 | 1,897 | 1,662 | 1,401 | 1,349 | 1,216 | 1,260 | 1,412 |
| 2003 | 1,457 | 1,557 | 1,575 | 1,938 | 2,199 | 2,006 | 1,781 | 1,626 | 1,349 | 1,049 | 1,105 | 1,162 |
| 2004 | 1,404 | 1,686 | 1,731 | 1,689 | 1,901 | 1,704 | 1,608 | 1,425 | 1,186 | 1,185 | 1,209 | 1,565 |
| 2005 | 1,799 | 1,745 | 1,658 | 1,814 | 1,907 | 1,789 | 1,520 | 1,049 | 1,088 | 1,014 | 995 | 1,128 |
| 2006 | 1,077 | 1,356 | 1,566 | 1,658 | 1,826 | 1,646 | 1,499 | 1,319 | 1,341 | 1,202 | 1,171 | 1,257 |
| 2007 | 1,263 | 1,443 | 1,463 | 1,783 | 1,771 | 1,606 | 1,356 | 1,142 | 1,182 | 1,052 | 1,056 | 1,346 |
| 2008 | 1,510 | 1,343 | 1,344 | 1,339 | 1,298 | 1,148 | 1,132 | 1,075 | 963 | 1,055 | 1,225 | 1,433 |
| 2009 | 1,314 | 1,497 | 1,685 | 2,075 | 2,119 | 1,812 | 1,471 | 1,108 | 1,021 | 1,005 | 941 | 1,041 |
| 2010 | 1,265 | 1,195 | 1,171 | 1,334 | 1,307 | 1,163 | 1,082 | 914 | 885 | 872 | 895 | 918 |
| 2011 | 787 | 767 | 975 | 1,092 | 1,278 | 1,101 | 1,187 | 928 | 813 | 825 | 787 | 584 |
| 2012 | 524 | 499 | 657 | 764 | 839 | 925 | 795 | 778 | 720 | 598 | 588 | 819 |
| 2013 | 820 | 820 | 733 | 702 | 684 | 723 | 747 | 787 | 602 | 454 | 434 | 591 |
| 2014 | 570 | 567 | 575 | 658 | 791 | 817 | 696 | 615 | 572 | 476 | 461 | 567 |
| 2015 | 527 | 413 | 563 | 680 | 723 | 498 | 419 | 382 | 468 | 459 | 576 | 757 |
| 2016 | 734 | 753 | 844 | 920 | 736 | 648 | 662 | 599 | 588 | 651 | 704 | 796 |
| 2017 | 841 | 743 | 782 | 822 | 753 | 611 | 570 | 516 | 509 | 457 | 554 | 839 |
| 2018 | 888 | 817 | 916 | 975 | 909 | 744 | 535 | 484 | 485 | 294 | 614 | 867 |
| 2019 | 952 | 953 | 975 | 960 | 960 | 851 | 794 | 798 | 687 | 563 | 663 | 924 |
| 2020 | 964 | 891 | 974 | 1,004 | 1,003 | 761 | 644 | 578 | 582 | 523 | 534 | 619 |
| 2021 | 657 | 505 | 671 | 749 | 818 | 704 | 743 | 760 | 634 | 666 | 754 | 914 |
| 2022 | 782 | 548 | 642 | 834 | 822 | 769 | 763 | 588 | 576 | 596 | 751 | 962 |
| 2023 | 1,014 | 1,029 | 1,061 | 1,033 | 979 | 849 | 892 | 715 | 679 | 584 | 565 | 659 |
| 2024 | 743 | |||||||||||
| - = No Data Reported; -- = Not Applicable; NA = Not Available; W = Withheld to avoid disclosure of individual company data. |
| Release Date: 3/29/2024 |
| Next Release Date: 4/30/2024 |