|
Download Data (XLS File) |
|
||||||||
|
||||||||
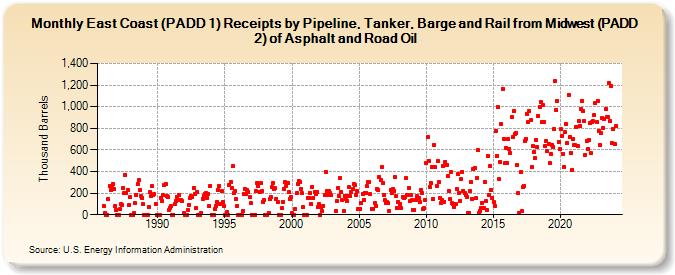
| East Coast (PADD 1) Receipts by Pipeline, Tanker, and Barge from Midwest (PADD 2) of Asphalt and Road Oil (Thousand Barrels) | ||||||||
| Year | Jan | Feb | Mar | Apr | May | Jun | Jul | Aug | Sep | Oct | Nov | Dec |
|---|---|---|---|---|---|---|---|---|---|---|---|---|
| 1986 | 77 | 14 | 0 | 0 | 141 | 268 | 227 | 255 | 288 | 237 | 79 | 43 |
| 1987 | 0 | 0 | 49 | 101 | 94 | 248 | 199 | 370 | 199 | 229 | 87 | 164 |
| 1988 | 0 | 0 | 0 | 14 | 106 | 182 | 282 | 317 | 229 | 169 | 157 | 100 |
| 1989 | 0 | 0 | 0 | 0 | 69 | 207 | 175 | 263 | 184 | 188 | 101 | 0 |
| 1990 | 0 | 0 | 0 | 152 | 131 | 179 | 273 | 283 | 172 | 168 | 41 | 66 |
| 1991 | 78 | 0 | 0 | 97 | 124 | 168 | 137 | 183 | 136 | 136 | 123 | 13 |
| 1992 | 0 | 0 | 0 | 42 | 93 | 156 | 176 | 161 | 251 | 190 | 60 | 208 |
| 1993 | 0 | 0 | 0 | 14 | 144 | 175 | 195 | 202 | 155 | 195 | 85 | 270 |
| 1994 | 0 | 0 | 0 | 52 | 85 | 120 | 231 | 266 | 96 | 217 | 121 | 84 |
| 1995 | 0 | 0 | 26 | 0 | 271 | 305 | 246 | 447 | 198 | 217 | 145 | 83 |
| 1996 | 0 | 0 | 0 | 0 | 31 | 188 | 235 | 192 | 225 | 214 | 163 | 108 |
| 1997 | 0 | 0 | 0 | 0 | 215 | 295 | 265 | 213 | 295 | 219 | 116 | 136 |
| 1998 | 0 | 0 | 0 | 19 | 142 | 166 | 252 | 292 | 236 | 244 | 149 | 114 |
| 1999 | 0 | 0 | 0 | 61 | 122 | 240 | 301 | 269 | 297 | 209 | 149 | 163 |
| 2000 | 17 | 0 | 0 | 51 | 197 | 286 | 310 | 302 | 240 | 197 | 68 | 0 |
| 2001 | 0 | 0 | 159 | 158 | 201 | 103 | 259 | 158 | 209 | 188 | 210 | 74 |
| 2002 | 98 | 0 | 69 | 30 | 83 | 178 | 400 | 219 | 183 | 215 | 200 | 178 |
| 2003 | 34 | 124 | 245 | 169 | 338 | 210 | 134 | 34 | 177 | |||
| 2004 | 147 | 125 | 173 | 254 | 174 | 213 | 239 | 286 | 277 | 185 | 216 | 53 |
| 2005 | 53 | 106 | 195 | 138 | 204 | 201 | 263 | 304 | 303 | 188 | 54 | |
| 2006 | 52 | 112 | 85 | 240 | 225 | 351 | 324 | 444 | 297 | 185 | 132 | |
| 2007 | 112 | 115 | 105 | 35 | 228 | 197 | 235 | 221 | 351 | 169 | 66 | 118 |
| 2008 | 97 | 64 | 164 | 153 | 167 | 336 | 186 | 246 | 123 | 182 | 133 | |
| 2009 | 45 | 44 | 133 | 169 | 153 | 114 | 228 | 199 | 50 | 60 | 140 | |
| 2010 | 478 | 717 | 498 | 259 | 295 | 441 | 142 | 644 | 438 | 266 | 499 | 304 |
| 2011 | 158 | 112 | 133 | 452 | 121 | 491 | 460 | 356 | 220 | 144 | 400 | 106 |
| 2012 | 95 | 73 | 95 | 242 | 376 | 203 | 131 | 329 | 396 | 222 | 198 | 187 |
| 2013 | 164 | 20 | 20 | 222 | 302 | 144 | 423 | 428 | 151 | 342 | 597 | 20 |
| 2014 | 39 | 58 | 113 | 61 | 302 | 127 | 42 | 547 | 184 | 453 | 227 | 156 |
| 2015 | 116 | 83 | 773 | 545 | 997 | 327 | 489 | 839 | 1,168 | 703 | 475 | 622 |
| 2016 | 480 | 701 | 607 | 569 | 903 | 716 | 961 | 749 | 761 | 458 | 198 | 20 |
| 2017 | 393 | 30 | 257 | 268 | 685 | 705 | 934 | 857 | 956 | 873 | 439 | 632 |
| 2018 | 579 | 524 | 691 | 628 | 918 | 993 | 1,041 | 858 | 1,012 | 861 | 638 | 683 |
| 2019 | 588 | 650 | 478 | 560 | 649 | 628 | 790 | 1,234 | 969 | 1,056 | 676 | 610 |
| 2020 | 791 | 731 | 565 | 442 | 763 | 839 | 663 | 1,107 | 723 | 574 | 418 | 698 |
| 2021 | 645 | 643 | 815 | 634 | 865 | 819 | 979 | 1,054 | 960 | 867 | 555 | 686 |
| 2022 | 611 | 691 | 853 | 570 | 858 | 865 | 924 | 1,035 | 858 | 1,057 | 778 | 649 |
| 2023 | 753 | 891 | 805 | 885 | 980 | 900 | 904 | 1,215 | 863 | 1,194 | 663 | 791 |
| 2024 | 648 | |||||||||||
| - = No Data Reported; -- = Not Applicable; NA = Not Available; W = Withheld to avoid disclosure of individual company data. |
| Release Date: 3/29/2024 |
| Next Release Date: 4/30/2024 |